Gloucester City: Fire Incidents, New Jersey (NJ)
Where are fire incidents reported in Gloucester City, NJ
Something went wrong! Please refresh the page.
| Fire incidents reported | |
|---|---|
| Sreet name | Count |
| MARKET ST | 328 |
| BROADWAY | 282 |
| KING ST | 124 |
| POWELL ST | 92 |
| MONMOUTH ST | 88 |
| MIDDLESEX ST | 84 |
| BURLINGTON ST | 76 |
| HUNTER ST | 76 |
| WATER ST | 50 |
| BERGEN ST | 48 |
| HUDSON ST | 48 |
| CUMBERLAND ST | 42 |
| JERSEY AVE | 42 |
| ROUTE 130 | 40 |
| CRESCENT HWY | 36 |
| MERCER ST | 34 |
| MORRIS ST | 34 |
| RIDGEWAY ST | 34 |
| SOMERSET ST | 34 |
| SUSSEX ST | 32 |
| 3RD ST | 30 |
| CHARLES ST | 30 |
| BROWN ST | 28 |
| JERSEY | 22 |
| LEHIGH AVE | 20 |
| NICHOLSON RD | 20 |
| ROUTE 76 HWY | 20 |
| ATLANTIC ST | 18 |
| ESSEX ST | 18 |
| THOMPSON AVE | 18 |
2002 - 2018 National Fire Incident Reporting System (NFIRS) incidents
- Incident types reported to NFIRS in Gloucester City, NJ
- 1,99224.6%Rescue & EMS
- 1,91923.7%Hazardous Condition
- 1,48018.2%Fire
- 1,09613.5%Service Call
- 7929.8%False Alarm
- 7909.7%Good Intent Call
- 270.3%Special Incident
- 90.1%Severe Weather
- Fire incident types reported to NFIRS in Gloucester City, NJ
- 95864.7%Structure Fires
- 32121.7%Outside Fires
- 18212.3%Mobile Property/Vehicle Fires
- 191.3%Other
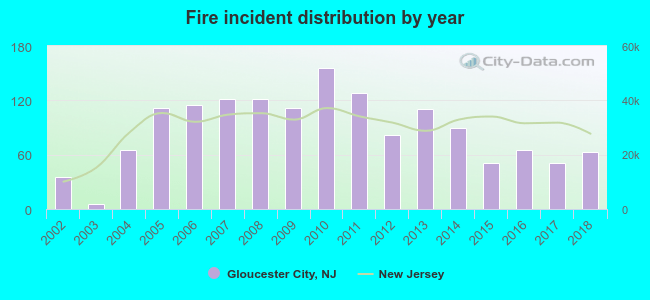 Based on the data from the years 2002 - 2018 the average number of fires per year is 87. The highest number of fire incidents - 156 took place in 2010, and the least - 5 in 2003. The data has an increasing trend.
The average number of yearly fire incidents per 10k residents in Gloucester City, NJ compared to nearest cities:
(Note: Based on data for the last 3 years, including only cities with population 5,000 and above)
| Gloucester City: | 52.7 |
| Bellmawr: | 51.2 |
| Audubon: | 35.6 |
| Collingswood: | 84.3 |
| Haddon Heights: | 29.4 |
| Camden: | 55.5 |
| Runnemede: | 46.2 |
| Barrington: | 61.0 |
| Haddonfield: | 26.9 |
 The median response time based on all reported fire incidents is 4 minutes. This is lower than the state median value.
The median response time in Gloucester City, NJ compared to nearest cities:
(Note: Based on data for all years, including only cities with at least 500 fire incidents)
| Gloucester City: | 4 minutes |
| Westville: | 6 minutes |
| Bellmawr: | 6 minutes |
| Audubon: | 5 minutes |
| Collingswood: | 4 minutes |
| Haddon Heights: | 6 minutes |
| Camden: | 4 minutes |
| Runnemede: | 7 minutes |
| Barrington: | 7 minutes |
 According to the data from the years 2002 - 2018 the average number of fire-related yearly casualties is 1. The highest number of injuries - 4 took place in 2011, and the lowest - 0 in 2002. The data has a constant trend.
The average number of injuries per 1,000 fires is 6. This indicator was the highest - 31 in 2011, and the lowest 0 in 2002. The trend for injuries per 1,000 incidents is constant. Compared to the New Jersey value the number of injuries per 1,000 fires is similar.
According to the data from the years 2002 - 2018 the average number of fire-related yearly casualties is 1. The highest number of injuries - 4 took place in 2011, and the lowest - 0 in 2002. The data has a constant trend.
The average number of injuries per 1,000 fires is 6. This indicator was the highest - 31 in 2011, and the lowest 0 in 2002. The trend for injuries per 1,000 incidents is constant. Compared to the New Jersey value the number of injuries per 1,000 fires is similar.Casualties per 1,000 incidents in Gloucester City, NJ compared to nearest cities:
(Note: Based on data for all years, including only cities with at least 500 fire incidents)
| Gloucester City: | 7.4 |
| Westville: | 20.4 |
| Bellmawr: | 13.4 |
| Audubon: | 6.2 |
| Collingswood: | 13.0 |
| Haddon Heights: | 3.8 |
| Camden: | 17.0 |
| Runnemede: | 0.0 |
| Barrington: | 0.0 |
 36.6% incidents where reported in the morning and 63.4% in the evening. The most fires (16.6%) took place on Sunday, and the least (12.2%) on Tuesday.
 Based on the 1,480 reports from years 2002 - 2018 most fires (12.8%) took place during March, and the least (4.9%) in September.
 Out of all 8,113 cases reported during the years 2002 - 2018, the most belonged to the categories: Rescue & EMS (24.6%), Hazardous Condition (23.7%), and Fire (18.2%).
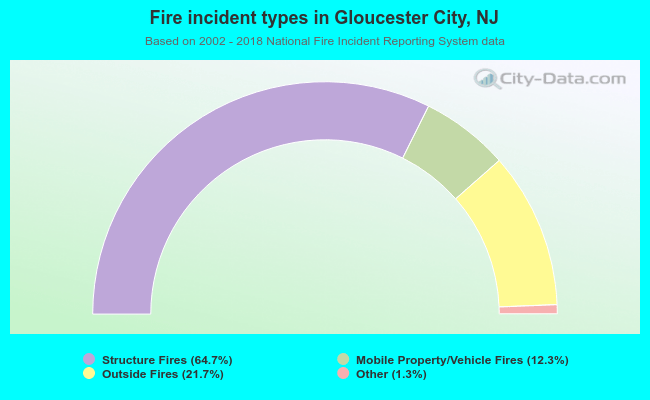 When looking into fire subcategories, the most reports belonged to: Structure Fires (64.7%), and Outside Fires (21.7%).