Runnemede: Fire Incidents, New Jersey (NJ)
Where are fire incidents reported in Runnemede, NJ
Something went wrong! Please refresh the page.
|
| |||||||||||||||||||||||||||||||||||||||||||||||||||||||||||||||||||||||||||||||||||||||||||||||||||||||||||||
2003 - 2018 National Fire Incident Reporting System (NFIRS) incidents
- Incident types reported to NFIRS in Runnemede, NJ
- 83427.8%Hazardous Condition
- 69823.3%Fire
- 49316.4%Rescue & EMS
- 42514.2%Good Intent Call
- 32110.7%False Alarm
- 2097.0%Service Call
- 110.4%Severe Weather
- 60.2%Special Incident
- 50.2%Overpressure Rupture
- Fire incident types reported to NFIRS in Runnemede, NJ
- 43862.8%Structure Fires
- 12918.5%Mobile Property/Vehicle Fires
- 11917.0%Outside Fires
- 121.7%Other
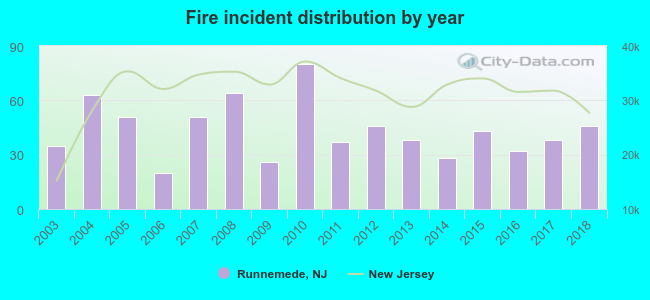 Based on the data from the years 2003 - 2018 the average number of fires per year is 44. The highest number of fire incidents - 80 took place in 2010, and the least - 20 in 2006. The data has a growing trend.
The average number of yearly fire incidents per 10k residents in Runnemede, NJ compared to nearest cities:
(Note: Based on data for the last 3 years, including only cities with population 5,000 and above)
| Runnemede: | 46.2 |
| Bellmawr: | 51.2 |
| Barrington: | 61.0 |
| Haddon Heights: | 29.4 |
| Audubon: | 35.6 |
| Somerdale: | 85.5 |
| Stratford: | 51.4 |
| Gloucester City: | 52.7 |
| Haddonfield: | 26.9 |
 The median response time based on all reported fire incidents is 7 minutes. This is higher compared to the state median value.
The median response time in Runnemede, NJ compared to nearest cities:
(Note: Based on data for all years, including only cities with at least 500 fire incidents)
| Runnemede: | 7 minutes |
| Bellmawr: | 6 minutes |
| Barrington: | 7 minutes |
| Haddon Heights: | 6 minutes |
| Magnolia: | 6 minutes |
| Audubon: | 5 minutes |
| Westville: | 6 minutes |
| Gloucester City: | 4 minutes |
| Haddonfield: | 6 minutes |
 33.0% incidents where reported in the morning and 67.0% in the evening. The most fires (16.6%) took place on Tuesday, and the least (11.6%) on Sunday.
 According to the 698 incident reports from years 2003 - 2018 most fires (10.2%) took place during June, and the least (5.6%) in November.
 Out of all 3,002 cases reported during the years 2003 - 2018, the most belonged to the categories: Hazardous Condition (27.8%), Fire (23.3%), and Rescue & EMS (16.4%).
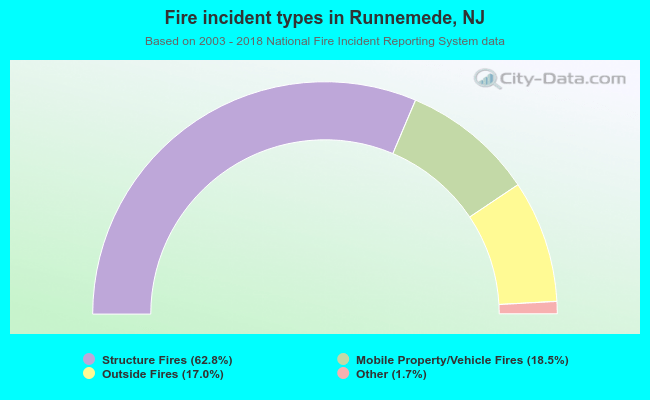 When looking into fire subcategories, the most reports belonged to: Structure Fires (62.8%), and Mobile Property/Vehicle Fires (18.5%).