Haddon Heights: Fire Incidents, New Jersey (NJ)
Where are fire incidents reported in Haddon Heights, NJ
Something went wrong! Please refresh the page.
|
| |||||||||||||||||||||||||||||||||||||||||||||||||||||||||||||||||||||||||||||||||||||||||||||||||||||||||||||
2002 - 2018 National Fire Incident Reporting System (NFIRS) incidents
- Incident types reported to NFIRS in Haddon Heights, NJ
- 74127.8%Rescue & EMS
- 59722.4%Hazardous Condition
- 52619.8%Fire
- 43116.2%Good Intent Call
- 2429.1%False Alarm
- 1013.8%Service Call
- 110.4%Severe Weather
- 70.3%Overpressure Rupture
- 70.3%Special Incident
- Fire incident types reported to NFIRS in Haddon Heights, NJ
- 34265.0%Structure Fires
- 12022.8%Outside Fires
- 5610.6%Mobile Property/Vehicle Fires
- 81.5%Other
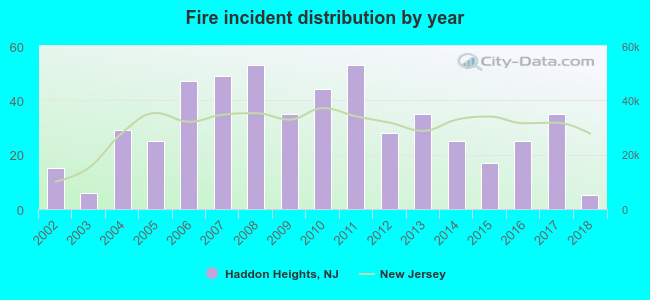 According to the data from the years 2002 - 2018 the average number of fires per year is 31. The highest number of reported fire incidents - 53 took place in 2008, and the least - 5 in 2018. The data has a dropping trend.
The average number of yearly fire incidents per 10k residents in Haddon Heights, NJ compared to nearest cities:
(Note: Based on data for the last 3 years, including only cities with population 5,000 and above)
| Haddon Heights: | 29.4 |
| Audubon: | 35.6 |
| Barrington: | 61.0 |
| Bellmawr: | 51.2 |
| Runnemede: | 46.2 |
| Haddonfield: | 26.9 |
| Collingswood: | 84.3 |
| Gloucester City: | 52.7 |
| Somerdale: | 85.5 |
 The median response time based on all reported fire incidents is 6 minutes. This is comparable to the state median value.
The median response time in Haddon Heights, NJ compared to nearest cities:
(Note: Based on data for all years, including only cities with at least 500 fire incidents)
| Haddon Heights: | 6 minutes |
| Audubon: | 5 minutes |
| Barrington: | 7 minutes |
| Bellmawr: | 6 minutes |
| Runnemede: | 7 minutes |
| Haddonfield: | 6 minutes |
| Magnolia: | 6 minutes |
| Collingswood: | 4 minutes |
| Gloucester City: | 4 minutes |
 31.6% incidents where reported in the morning and 68.4% in the evening. The most fires (19.0%) took place on Thursday, and the least (12.0%) on Sunday.
 Based on the 526 fire incident reports from years 2002 - 2018 most fires (10.3%) took place during November, and the least (5.5%) in August.
 Out of all 2,663 cases reported during the years 2002 - 2018, the most belonged to the categories: Rescue & EMS (27.8%), Hazardous Condition (22.4%), and Fire (19.8%).
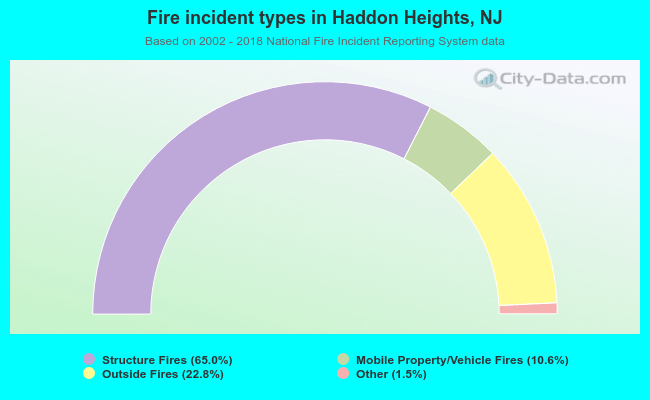 When looking into fire subcategories, the most incidents belonged to: Structure Fires (65.0%), and Outside Fires (22.8%).