Camden: Fire Incidents, New Jersey (NJ)
Where are fire incidents reported in Camden, NJ
Something went wrong! Please refresh the page.
| Fire incidents reported | |
|---|---|
| Sreet name | Count |
| 7TH ST | 912 |
| 6TH ST | 576 |
| FEDERAL ST | 498 |
| MICKLE BLVD | 498 |
| BROADWAY | 462 |
| 8TH ST | 424 |
| STATE ST | 392 |
| 4TH ST | 372 |
| MT. EPHRAIM AVE | 366 |
| HADDON AVE | 356 |
| PARK BLVD | 300 |
| WESTFIELD AVE | 286 |
| 5TH ST | 272 |
| 3RD ST | 268 |
| FERRY AVE | 248 |
| BENSON ST | 246 |
| 9TH ST | 242 |
| 10TH ST | 228 |
| 27TH ST | 202 |
| 32ND ST | 200 |
| KAIGHNS AVE | 200 |
| 28TH ST | 190 |
| 24TH ST | 174 |
| COOPER ST | 172 |
| 26TH ST | 170 |
| 30TH ST | 164 |
| LINE ST | 160 |
| CHESTNUT ST | 158 |
| BAIRD BLVD | 150 |
| 25TH ST | 144 |
| Other | 1,339 |
2005 - 2018 National Fire Incident Reporting System (NFIRS) incidents
- Incident types reported to NFIRS in Camden, NJ
- 10,36934.9%Fire
- 7,80926.3%Hazardous Condition
- 4,13013.9%Rescue & EMS
- 3,52611.9%False Alarm
- 2,5568.6%Service Call
- 1,1243.8%Good Intent Call
- 780.3%Overpressure Rupture
- 520.2%Special Incident
- 420.1%Severe Weather
- Fire incident types reported to NFIRS in Camden, NJ
- 6,00557.9%Structure Fires
- 2,61325.2%Outside Fires
- 1,70416.4%Mobile Property/Vehicle Fires
- 470.5%Other
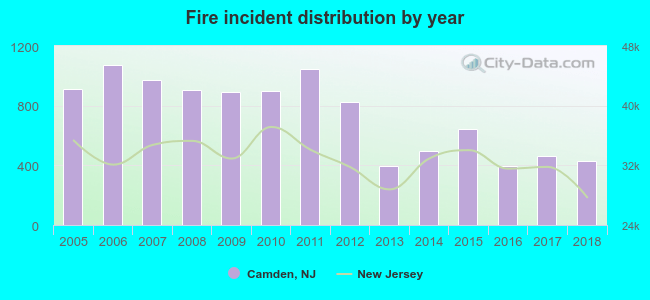 Based on the data from the years 2005 - 2018 the average number of fire incidents per year is 739. The highest number of reported fire incidents - 1,070 took place in 2006, and the least - 393 in 2013. The data has a dropping trend.
The average number of yearly fire incidents per 10k residents in Camden, NJ compared to nearest cities:
(Note: Based on data for the last 3 years, including only cities with population 5,000 and above)
| Camden: | 55.5 |
| Collingswood: | 84.3 |
| Pennsauken: | 43.1 |
| Gloucester City: | 52.7 |
| Audubon: | 35.6 |
| Haddon Heights: | 29.4 |
| Haddonfield: | 26.9 |
| Bellmawr: | 51.2 |
| Barrington: | 61.0 |
 The median response time based on all reported fire incidents is 4 minutes. This is lower compared to the New Jersey median value.
The median response time in Camden, NJ compared to nearest cities:
(Note: Based on data for all years, including only cities with at least 500 fire incidents)
| Camden: | 4 minutes |
| Collingswood: | 4 minutes |
| Pennsauken: | 5 minutes |
| Gloucester City: | 4 minutes |
| Audubon: | 5 minutes |
| Haddon Heights: | 6 minutes |
| Haddonfield: | 6 minutes |
| Bellmawr: | 6 minutes |
| Westville: | 6 minutes |
 According to the reports from the years 2005 - 2018 the average number of fire-related yearly deaths is 2. The highest number of deaths - 7 took place in 2006, and the lowest - 0 in 2007. The data has a constant trend.
The average number of deaths per 1,000 fire incidents is 2. This indicator was the highest - 7 in 2012, and the lowest 0 in 2007. The trend for deaths per 1,000 fire incidents is increasing. Compared to the state value the number of fatalities per 1,000 fire incidents is higher.
According to the reports from the years 2005 - 2018 the average number of fire-related yearly deaths is 2. The highest number of deaths - 7 took place in 2006, and the lowest - 0 in 2007. The data has a constant trend.
The average number of deaths per 1,000 fire incidents is 2. This indicator was the highest - 7 in 2012, and the lowest 0 in 2007. The trend for deaths per 1,000 fire incidents is increasing. Compared to the state value the number of fatalities per 1,000 fire incidents is higher.Deaths per 1,000 incidents in Camden, NJ compared to nearest cities:
(Note: Based on data for all years, including only cities with at least 2,500 fire incidents)
| Camden: | 2.1 |
 According to the reports from the years 2005 - 2018 the average number of fire-related yearly casualties is 13. The highest number of reported casualties - 44 took place in 2006, and the lowest - 0 in 2013. The data has a dropping trend.
The average number of injuries per 1,000 fires is 14. This indicator was the highest - 41 in 2006, and the lowest 0 in 2013. The trend for casualties per 1,000 incidents is dropping. Compared to the New Jersey value the number of casualties per 1,000 fire incidents is higher.
According to the reports from the years 2005 - 2018 the average number of fire-related yearly casualties is 13. The highest number of reported casualties - 44 took place in 2006, and the lowest - 0 in 2013. The data has a dropping trend.
The average number of injuries per 1,000 fires is 14. This indicator was the highest - 41 in 2006, and the lowest 0 in 2013. The trend for casualties per 1,000 incidents is dropping. Compared to the New Jersey value the number of casualties per 1,000 fire incidents is higher.Casualties per 1,000 incidents in Camden, NJ compared to nearest cities:
(Note: Based on data for all years, including only cities with at least 500 fire incidents)
| Camden: | 17.0 |
| Collingswood: | 13.0 |
| Pennsauken: | 9.0 |
| Gloucester City: | 7.4 |
| Audubon: | 6.2 |
| Haddon Heights: | 3.8 |
| Haddonfield: | 1.4 |
| Bellmawr: | 13.4 |
| Westville: | 20.4 |
 36.8% incidents where reported in the morning and 63.2% in the evening. The most fires (15.2%) took place on Sunday, and the least (12.6%) on Wednesday.
 Based on the 10,369 fires from years 2005 - 2018 most fires (10.2%) took place during April, and the least (6.7%) in August.
 Out of all 29,686 cases reported during the years 2005 - 2018, the most belonged to the categories: Fire (34.9%), Hazardous Condition (26.3%), and Rescue & EMS (13.9%).
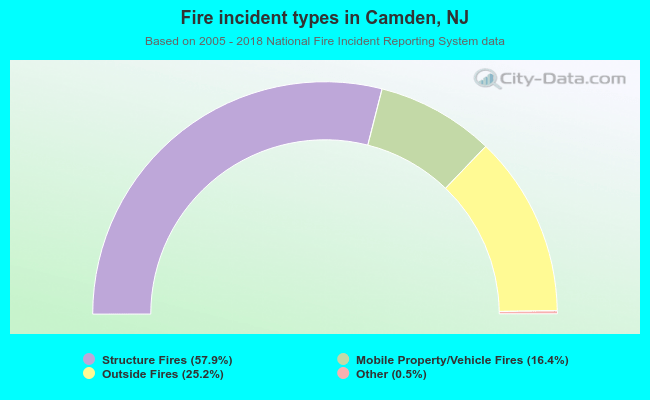 When looking into fire subcategories, the most incidents belonged to: Structure Fires (57.9%), and Outside Fires (25.2%).