Lakewood: Fire Incidents, Washington (WA)
Where are fire incidents reported in Lakewood, WA
Something went wrong! Please refresh the page.
| Fire incidents reported | |
|---|---|
| Sreet name | Count |
| BRIDGEPORT WY | 196 |
| STEILACOOM BL | 190 |
| 146TH ST | 182 |
| 150TH ST | 182 |
| TACOMA WY | 150 |
| STEILACOOM BLVD | 144 |
| GRAVELLY LAKE DR | 142 |
| I5 HW | 142 |
| 100TH ST | 140 |
| LAKEWOOD DR | 126 |
| I5 HWY | 120 |
| 112TH ST | 96 |
| 84TH ST | 90 |
| PACIFIC HW | 90 |
| 96TH ST | 86 |
| PACIFIC HWY | 86 |
| UNION AV | 82 |
| ELWOOD DR | 80 |
| 92ND ST | 72 |
| TACOMA WAY | 68 |
| 82ND ST | 64 |
| WASHINGTON AV | 64 |
| 110TH ST | 62 |
| 47TH AV | 62 |
| BRIDGEPORT WAY | 60 |
| VETERANS DR | 56 |
| WOODBROOK DR | 56 |
| 83RD AV | 52 |
| 121ST ST | 50 |
| ADDISON ST | 50 |
| Other | 369 |
2002 - 2018 National Fire Incident Reporting System (NFIRS) incidents
- Incident types reported to NFIRS in Lakewood, WA
- 30,41662.7%Rescue & EMS
- 7,66115.8%Good Intent Call
- 3,4387.1%Service Call
- 3,4097.0%Fire
- 2,0004.1%Hazardous Condition
- 1,4373.0%False Alarm
- 750.2%Overpressure Rupture
- 680.1%Special Incident
- Fire incident types reported to NFIRS in Lakewood, WA
- 1,51744.5%Outside Fires
- 1,29938.1%Structure Fires
- 45613.4%Mobile Property/Vehicle Fires
- 1374.0%Other
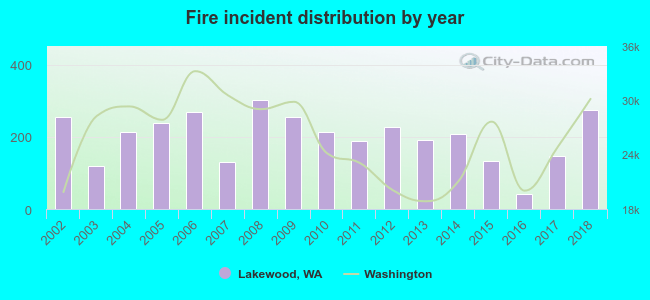 According to the data from the years 2002 - 2018 the average number of fires per year is 201. The highest number of reported fires - 301 took place in 2008, and the least - 41 in 2016. The data has a rising trend.
The average number of yearly fire incidents per 10k residents in Lakewood, WA compared to nearest cities:
(Note: Based on data for the last 3 years, including only cities with population 5,000 and above)
| Lakewood: | 25.9 |
| Steilacoom: | 8.1 |
| University Place: | 13.1 |
| Parkland: | 53.9 |
| Fircrest: | 9.5 |
| Tacoma: | 50.3 |
| Spanaway: | 42.1 |
| DuPont: | 2.9 |
| Fife: | 68.8 |
 The median response time based on all reported fire incidents is 7 minutes. This is close to the state median value.
The median response time in Lakewood, WA compared to nearest cities:
(Note: Based on data for all years, including only cities with at least 500 fire incidents)
| Lakewood: | 7 minutes |
| University Place: | 6 minutes |
| Parkland: | 6 minutes |
| Tacoma: | 5 minutes |
| Spanaway: | 7 minutes |
| Fife: | 5 minutes |
| Puyallup: | 7 minutes |
| Roy: | 13 minutes |
| Milton: | 7 minutes |
 According to the reports from the years 2002 - 2018 the average number of fire-related fatalities per year is 1. The highest number of deaths - 2 took place in 2002, and the lowest - 0 in 2003. The data has a decreasing trend.
The average number of deaths per 1,000 fires is 3. This indicator was the highest - 10 in 2013, and the lowest 0 in 2003. The trend for deaths per 1,000 incidents is decreasing. Compared to the Washington value the number of deaths per 1,000 fires is higher.
According to the reports from the years 2002 - 2018 the average number of fire-related fatalities per year is 1. The highest number of deaths - 2 took place in 2002, and the lowest - 0 in 2003. The data has a decreasing trend.
The average number of deaths per 1,000 fires is 3. This indicator was the highest - 10 in 2013, and the lowest 0 in 2003. The trend for deaths per 1,000 incidents is decreasing. Compared to the Washington value the number of deaths per 1,000 fires is higher.Deaths per 1,000 incidents in Lakewood, WA compared to nearest cities:
(Note: Based on data for all years, including only cities with at least 2,500 fire incidents)
| Lakewood: | 2.6 |
| Tacoma: | 0.5 |
| Puyallup: | 2.1 |
| Federal Way: | 2.0 |
| Auburn: | 2.5 |
| Olympia: | 1.4 |
 Based on the reports from the years 2002 - 2018 the average number of fire-related casualties per year is 1. The highest number of reported injuries - 2 took place in 2006, and the lowest - 0 in 2002. The data has a rising trend.
The average number of casualties per 1,000 fires is 3. This indicator was the highest - 8 in 2007, and the lowest 0 in 2002. The trend for casualties per 1,000 incidents is rising. Compared to the Washington value the number of casualties per 1,000 incidents is much lower.
Based on the reports from the years 2002 - 2018 the average number of fire-related casualties per year is 1. The highest number of reported injuries - 2 took place in 2006, and the lowest - 0 in 2002. The data has a rising trend.
The average number of casualties per 1,000 fires is 3. This indicator was the highest - 8 in 2007, and the lowest 0 in 2002. The trend for casualties per 1,000 incidents is rising. Compared to the Washington value the number of casualties per 1,000 incidents is much lower.
 32.5% incidents where reported in the morning and 67.5% in the evening. The most fires (16.2%) took place on Monday, and the least (12.1%) on Wednesday.
 Based on the 3,409 fire incidents from years 2002 - 2018 most fires (18.7%) took place during July, and the least (5.1%) in February.
 Out of all 48,506 cases reported during the years 2002 - 2018, the most belonged to the categories: Rescue & EMS (62.7%), Good Intent Call (15.8%), and Service Call (7.1%).
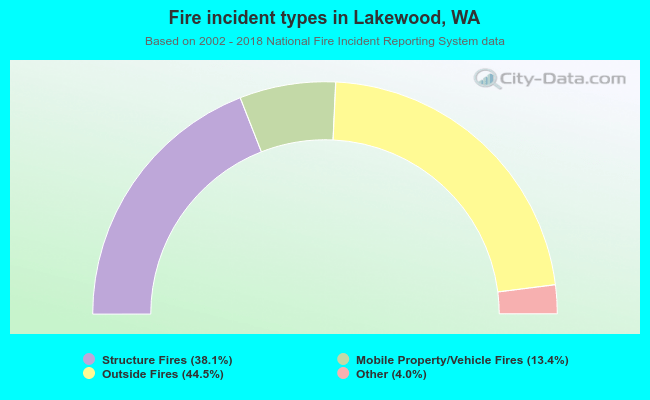 When looking into fire subcategories, the most incidents belonged to: Outside Fires (44.5%), and Structure Fires (38.1%).