Steilacoom: Fire Incidents, Washington (WA)
Where are fire incidents reported in Steilacoom, WA
Something went wrong! Please refresh the page.
|
| |||||||||||||||||||||||||||||||||||||||||||||||||||||||||||||||||||||||||||||||||||||||||||||||||||||||||||||
2002 - 2018 National Fire Incident Reporting System (NFIRS) incidents
- Incident types reported to NFIRS in Steilacoom, WA
- 1,60160.1%Rescue & EMS
- 28210.6%Fire
- 2629.8%Service Call
- 2619.8%Good Intent Call
- 1304.9%False Alarm
- 1134.2%Hazardous Condition
- 90.3%Special Incident
- 40.2%Overpressure Rupture
- Fire incident types reported to NFIRS in Steilacoom, WA
- 12544.3%Structure Fires
- 9734.4%Outside Fires
- 4014.2%Other
- 207.1%Mobile Property/Vehicle Fires
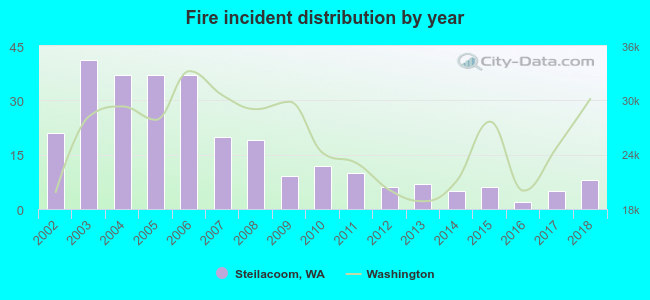 According to the data from the years 2002 - 2018 the average number of fires per year is 17. The highest number of reported fires - 41 took place in 2003, and the least - 2 in 2016. The data has a declining trend.
The average number of yearly fire incidents per 10k residents in Steilacoom, WA compared to nearest cities:
(Note: Based on data for the last 3 years, including only cities with population 5,000 and above)
| Steilacoom: | 8.1 |
| Lakewood: | 25.9 |
| University Place: | 13.1 |
| DuPont: | 2.9 |
| Fircrest: | 9.5 |
| Parkland: | 53.9 |
| Tacoma: | 50.3 |
| Spanaway: | 42.1 |
| Gig Harbor: | 86.8 |
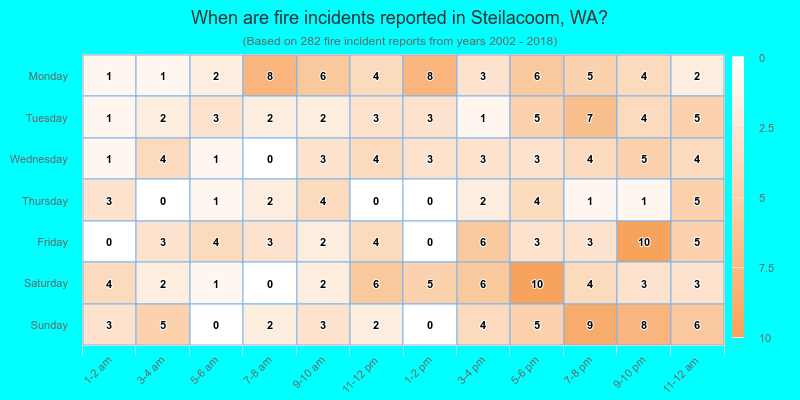
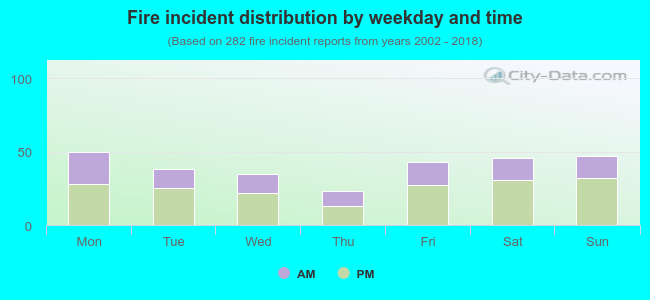 36.9% incidents where reported in the morning and 63.1% in the evening. The most fires (17.7%) took place on Monday, and the least (8.2%) on Thursday.
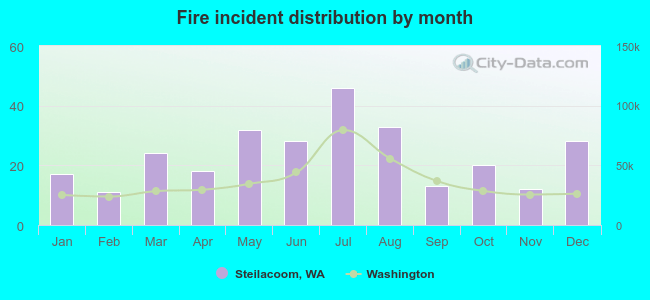 According to the 282 fires from years 2002 - 2018 most fires (16.3%) took place during July, and the least (3.9%) in February.
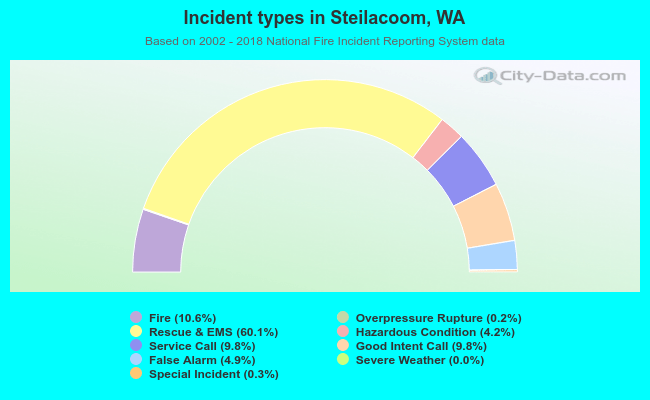 Out of all 2,663 cases reported during the years 2002 - 2018, the most belonged to the categories: Rescue & EMS (60.1%), Fire (10.6%), and Service Call (9.8%).
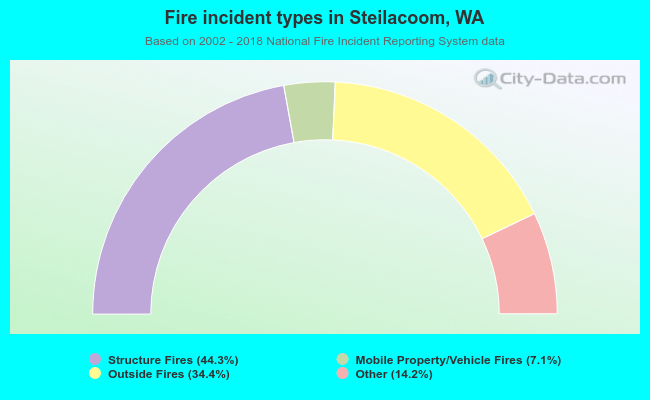 When looking into fire subcategories, the most incidents belonged to: Structure Fires (44.3%), and Outside Fires (34.4%).