University Place: Fire Incidents, Washington (WA)
Where are fire incidents reported in University Place, WA
Something went wrong! Please refresh the page.
| Fire incidents reported | |
|---|---|
| Sreet name | Count |
| BRIDGEPORT WY | 132 |
| GRANDVIEW DR | 108 |
| 27TH ST | 90 |
| BRIDGEPORT WAY | 90 |
| CHAMBERS CREEK RD | 76 |
| CIRQUE DR | 64 |
| 40TH ST | 62 |
| HANNAH PIERCE RD | 60 |
| 44TH ST | 58 |
| MILDRED ST | 52 |
| 70TH AV | 50 |
| 35TH ST | 44 |
| ORCHARD ST | 40 |
| LAKEWOOD DR | 38 |
| SUNSET DR | 38 |
| CRYSTAL SPRINGS RD | 36 |
| MORRISON RD | 30 |
| 19TH ST | 28 |
| 67TH AV | 24 |
| ELWOOD DR | 24 |
| 52ND ST | 20 |
| 60TH ST | 20 |
| 24TH ST | 18 |
| 56TH ST | 18 |
| 70TH AC | 18 |
| 70TH AVE | 18 |
| CASCADE PL | 18 |
| MT VIEW AV | 18 |
| 72ND AC | 16 |
| 78TH AC | 16 |
2002 - 2018 National Fire Incident Reporting System (NFIRS) incidents
- Incident types reported to NFIRS in University Place, WA
- 11,02366.8%Rescue & EMS
- 1,69310.3%Good Intent Call
- 1,3498.2%Service Call
- 1,2207.4%Fire
- 6403.9%Hazardous Condition
- 5443.3%False Alarm
- 190.1%Special Incident
- Fire incident types reported to NFIRS in University Place, WA
- 51141.9%Structure Fires
- 50041.0%Outside Fires
- 1098.9%Mobile Property/Vehicle Fires
- 1008.2%Other
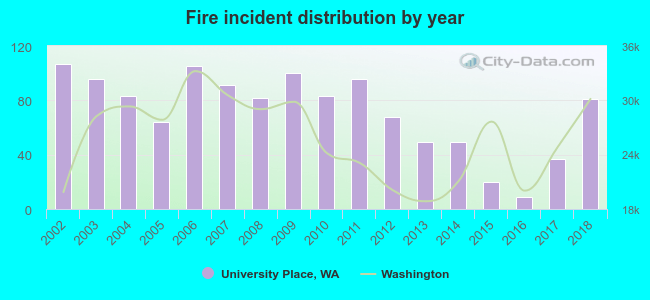 Based on the data from the years 2002 - 2018 the average number of fires per year is 72. The highest number of fire incidents - 107 took place in 2002, and the least - 9 in 2016. The data has a decreasing trend.
The average number of yearly fire incidents per 10k residents in University Place, WA compared to nearest cities:
(Note: Based on data for the last 3 years, including only cities with population 5,000 and above)
| University Place: | 13.1 |
| Fircrest: | 9.5 |
| Lakewood: | 25.9 |
| Tacoma: | 50.3 |
| Steilacoom: | 8.1 |
| Parkland: | 53.9 |
| Gig Harbor: | 86.8 |
| Fife: | 68.8 |
| DuPont: | 2.9 |
 The median response time based on all reported fire incidents is 6 minutes. This is comparable to the Washington median value.
The median response time in University Place, WA compared to nearest cities:
(Note: Based on data for all years, including only cities with at least 500 fire incidents)
| University Place: | 6 minutes |
| Lakewood: | 7 minutes |
| Tacoma: | 5 minutes |
| Parkland: | 6 minutes |
| Gig Harbor: | 9 minutes |
| Fife: | 5 minutes |
| Spanaway: | 7 minutes |
| Milton: | 7 minutes |
| Federal Way: | 6 minutes |
 Based on the data from the years 2002 - 2018 the average number of fire-related yearly casualties is 0. The highest number of reported casualties - 1 took place in 2010, and the lowest - 0 in 2002. The data has a constant trend.
The average number of injuries per 1,000 fire incidents is 3. This indicator was the highest - 20 in 2014, and the lowest 0 in 2002. The trend for injuries per 1,000 fire incidents is constant. Compared to the Washington value the number of injuries per 1,000 fires is much lower.
Based on the data from the years 2002 - 2018 the average number of fire-related yearly casualties is 0. The highest number of reported casualties - 1 took place in 2010, and the lowest - 0 in 2002. The data has a constant trend.
The average number of injuries per 1,000 fire incidents is 3. This indicator was the highest - 20 in 2014, and the lowest 0 in 2002. The trend for injuries per 1,000 fire incidents is constant. Compared to the Washington value the number of injuries per 1,000 fires is much lower.Casualties per 1,000 incidents in University Place, WA compared to nearest cities:
(Note: Based on data for all years, including only cities with at least 500 fire incidents)
| University Place: | 2.5 |
| Lakewood: | 3.2 |
| Tacoma: | 7.5 |
| Parkland: | 18.1 |
| Gig Harbor: | 15.1 |
| Fife: | 3.3 |
| Spanaway: | 13.0 |
| Milton: | 3.5 |
| Federal Way: | 21.1 |
 29.8% incidents where reported in the morning and 70.2% in the evening. The most fires (16.1%) took place on Saturday, and the least (11.4%) on Wednesday.
 According to the 1,220 incident reports from years 2002 - 2018 most fires (17.8%) took place during July, and the least (4.7%) in February.
 Out of all 16,496 cases reported during the years 2002 - 2018, the most belonged to the categories: Rescue & EMS (66.8%), Good Intent Call (10.3%), and Service Call (8.2%).
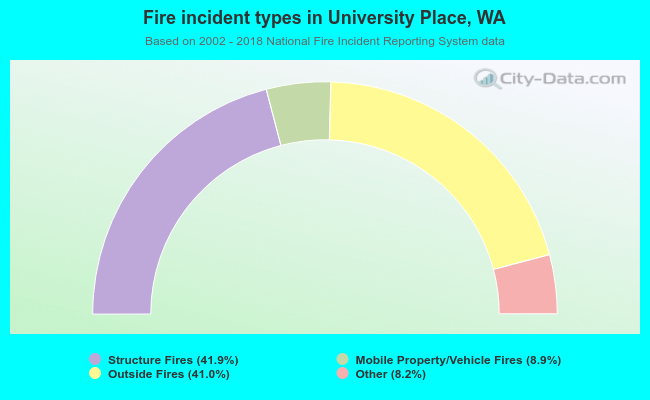 When looking into fire subcategories, the most incidents belonged to: Structure Fires (41.9%), and Outside Fires (41.0%).