Fircrest: Fire Incidents, Washington (WA)
Where are fire incidents reported in Fircrest, WA
Something went wrong! Please refresh the page.
|
| |||||||||||||||||||||||||||||||||||||||||||||||||||||||||||||||||||||||||||||||||||||||||||||||||||||||||||||
2002 - 2018 National Fire Incident Reporting System (NFIRS) incidents
- Incident types reported to NFIRS in Fircrest, WA
- 2,15966.5%Rescue & EMS
- 2949.1%Service Call
- 2517.7%Hazardous Condition
- 1735.3%Good Intent Call
- 1554.8%Fire
- 1093.4%Special Incident
- 1023.1%False Alarm
- Fire incident types reported to NFIRS in Fircrest, WA
- 9460.6%Outside Fires
- 5032.3%Structure Fires
- 117.1%Mobile Property/Vehicle Fires
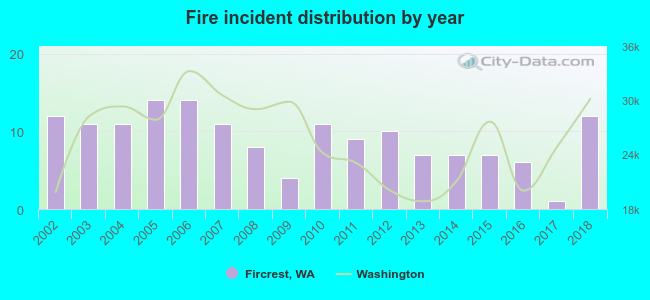 Based on the data from the years 2002 - 2018 the average number of fires per year is 9. The highest number of reported fires - 14 took place in 2005, and the least - 1 in 2017. The data has a constant trend.
The average number of yearly fire incidents per 10k residents in Fircrest, WA compared to nearest cities:
(Note: Based on data for the last 3 years, including only cities with population 5,000 and above)
| Fircrest: | 9.5 |
| University Place: | 13.1 |
| Tacoma: | 50.3 |
| Lakewood: | 25.9 |
| Steilacoom: | 8.1 |
| Parkland: | 53.9 |
| Fife: | 68.8 |
| Gig Harbor: | 86.8 |
| Milton: | 38.0 |
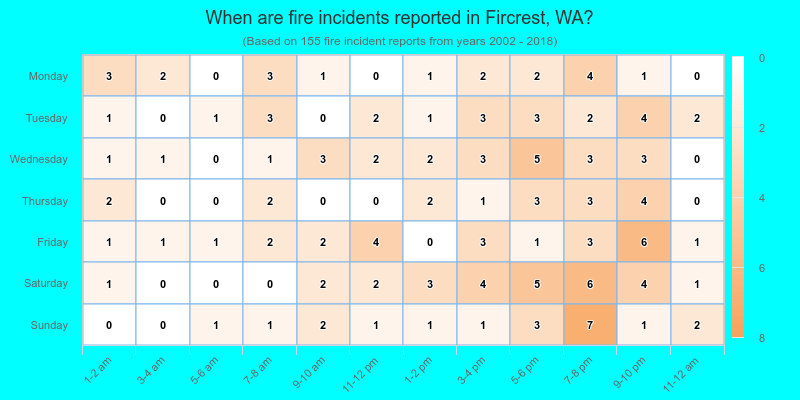
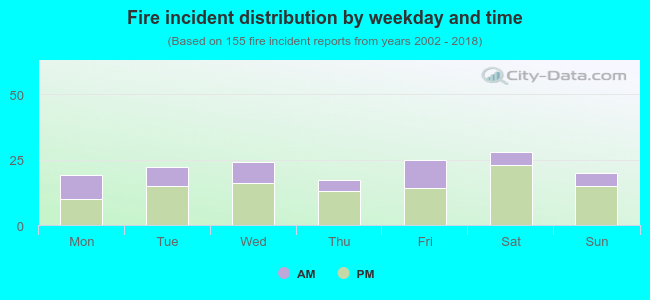 31.6% incidents where reported in the morning and 68.4% in the evening. The most fires (18.1%) took place on Saturday, and the least (11.0%) on Thursday.
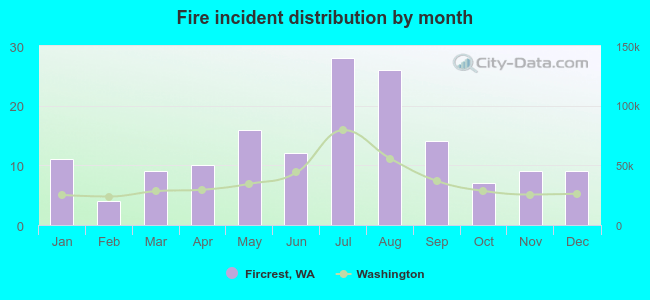 Based on the 155 fire incident reports from years 2002 - 2018 most fires (18.1%) took place during July, and the least (2.6%) in February.
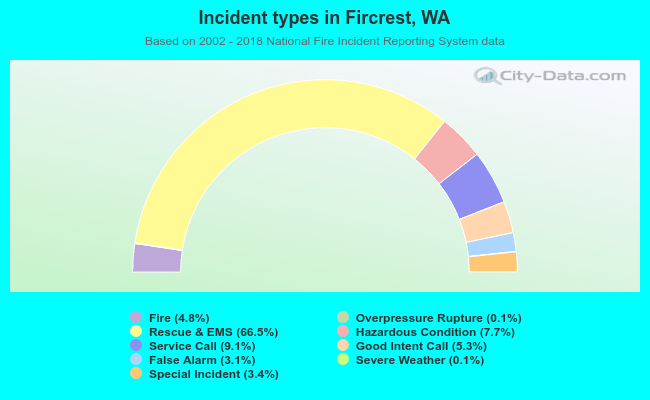 Out of all 3,248 cases reported during the years 2002 - 2018, the most belonged to the categories: Rescue & EMS (66.5%), Service Call (9.1%), and Hazardous Condition (7.7%).
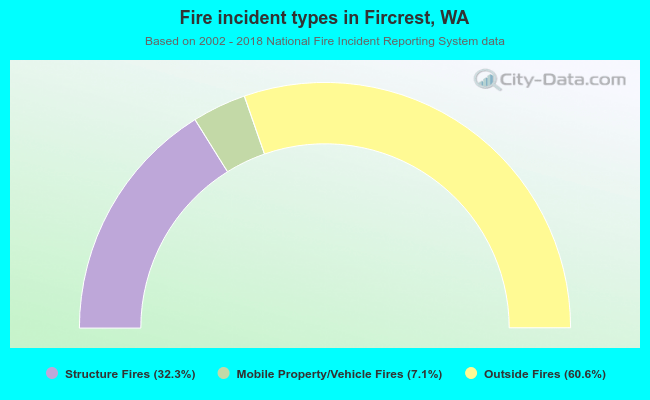 When looking into fire subcategories, the most incidents belonged to: Outside Fires (60.6%), and Structure Fires (32.3%).