Spanaway: Fire Incidents, Washington (WA)
Where are fire incidents reported in Spanaway, WA
Something went wrong! Please refresh the page.
| Fire incidents reported | |
|---|---|
| Sreet name | Count |
| MOUNTAIN HWY | 118 |
| MOUNTAIN HW | 92 |
| PACIFIC AVE | 90 |
| 208TH ST | 70 |
| MOUNTAIN | 66 |
| PACIFIC AV | 58 |
| B ST | 48 |
| 176TH ST | 44 |
| 224TH ST | 44 |
| 168TH ST | 42 |
| 38TH AVE | 42 |
| A ST | 36 |
| 192ND ST | 32 |
| 232ND ST | 30 |
| 22ND AV | 24 |
| 46TH AV | 24 |
| 10TH AVE | 22 |
| 211TH ST | 22 |
| 22ND AVE | 22 |
| 38TH AV | 22 |
| EUSTIS HUNT RD | 22 |
| 175TH ST | 20 |
| 200TH ST | 20 |
| 46TH AVE | 20 |
| 14TH AVE | 18 |
| 161ST ST | 18 |
| 166TH ST | 18 |
| 170TH ST | 18 |
| 173RD ST | 18 |
| 8TH AV | 18 |
| Other | 395 |
2002 - 2018 National Fire Incident Reporting System (NFIRS) incidents
- Incident types reported to NFIRS in Spanaway, WA
- 18,60974.3%Rescue & EMS
- 1,8527.4%Good Intent Call
- 1,7296.9%Service Call
- 1,5336.1%Fire
- 6892.8%False Alarm
- 5712.3%Hazardous Condition
- 360.1%Special Incident
- Fire incident types reported to NFIRS in Spanaway, WA
- 63141.2%Outside Fires
- 61039.8%Structure Fires
- 22914.9%Mobile Property/Vehicle Fires
- 634.1%Other
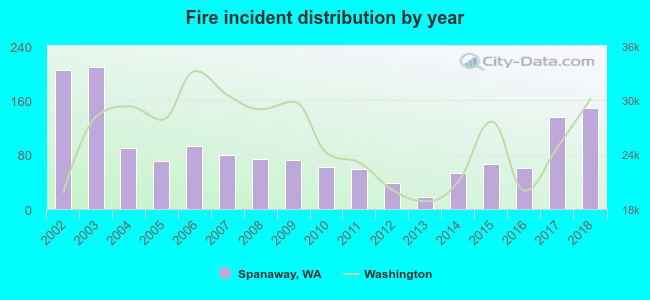 According to the data from the years 2002 - 2018 the average number of fire incidents per year is 90. The highest number of fires - 209 took place in 2003, and the least - 17 in 2013. The data has a declining trend.
The average number of yearly fire incidents per 10k residents in Spanaway, WA compared to nearest cities:
(Note: Based on data for the last 3 years, including only cities with population 5,000 and above)
| Spanaway: | 42.1 |
| Parkland: | 53.9 |
| South Hill: | 26.4 |
| Lakewood: | 25.9 |
| Graham: | 38.6 |
| Puyallup: | 47.5 |
| Steilacoom: | 8.1 |
| Fife: | 68.8 |
| DuPont: | 2.9 |
 The median response time based on all reported fire incidents is 7 minutes. This is close to the state median value.
The median response time in Spanaway, WA compared to nearest cities:
(Note: Based on data for all years, including only cities with at least 500 fire incidents)
| Spanaway: | 7 minutes |
| Parkland: | 6 minutes |
| Lakewood: | 7 minutes |
| Graham: | 9 minutes |
| Puyallup: | 7 minutes |
| Roy: | 13 minutes |
| Fife: | 5 minutes |
| Tacoma: | 5 minutes |
| University Place: | 6 minutes |
 According to the data from the years 2002 - 2018 the average number of fire-related fatalities per year is 0. The highest number of deaths - 1 took place in 2003, and the lowest - 0 in 2002. The data has a growing trend.
 Based on the data from the years 2002 - 2018 the average number of fire-related yearly casualties is 1. The highest number of reported injuries - 5 took place in 2003, and the lowest - 0 in 2002. The data has a constant trend.
The average number of casualties per 1,000 fire incidents is 16. This indicator was the highest - 57 in 2014, and the lowest 0 in 2002. The trend for casualties per 1,000 incidents is constant. Compared to the Washington value the number of casualties per 1,000 fires is higher.
Based on the data from the years 2002 - 2018 the average number of fire-related yearly casualties is 1. The highest number of reported injuries - 5 took place in 2003, and the lowest - 0 in 2002. The data has a constant trend.
The average number of casualties per 1,000 fire incidents is 16. This indicator was the highest - 57 in 2014, and the lowest 0 in 2002. The trend for casualties per 1,000 incidents is constant. Compared to the Washington value the number of casualties per 1,000 fires is higher.
 29.8% incidents where reported in the morning and 70.2% in the evening. The most fires (15.1%) took place on Friday, and the least (13.3%) on Tuesday.
 According to the 1,533 fire incident reports from years 2002 - 2018 most fires (19.6%) took place during July, and the least (4.7%) in January.
 Out of all 25,033 cases reported during the years 2002 - 2018, the most belonged to the categories: Rescue & EMS (74.3%), Good Intent Call (7.4%), and Service Call (6.9%).
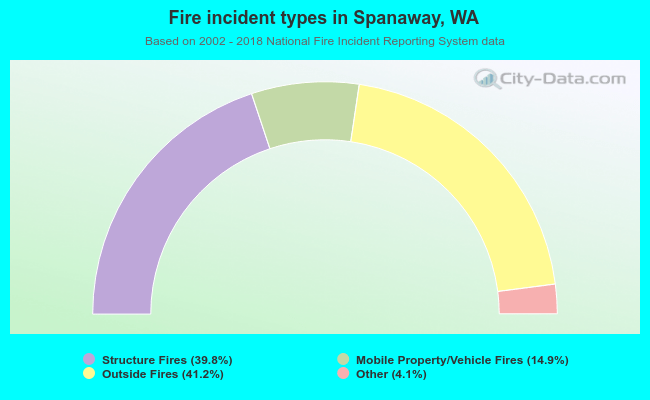 When looking into fire subcategories, the most incidents belonged to: Outside Fires (41.2%), and Structure Fires (39.8%).