Puyallup: Fire Incidents, Washington (WA)
Where are fire incidents reported in Puyallup, WA
Something went wrong! Please refresh the page.
| Fire incidents reported | |
|---|---|
| Sreet name | Count |
| RIVER RD | 340 |
| MERIDIAN | 296 |
| CANYON RD | 222 |
| MERIDIAN ST | 216 |
| MAIN AV | 146 |
| MERIDIAN AVE | 134 |
| MAIN | 122 |
| MERIDIAN AV | 116 |
| 7TH ST | 100 |
| 39TH AV | 90 |
| PIONEER WAY | 90 |
| VALLEY AV | 86 |
| 176TH ST | 84 |
| 31ST AV | 84 |
| 9TH ST | 82 |
| 184TH ST | 80 |
| 5TH ST | 68 |
| 160TH ST | 64 |
| 4TH ST | 64 |
| 512 HWY | 64 |
| 43RD AV | 60 |
| 122ND ST | 58 |
| 9TH AV | 56 |
| PIONEER AV | 56 |
| SHAW RD | 56 |
| VALLEY AVE | 54 |
| 128TH ST | 52 |
| 4TH AV | 50 |
| 7TH AV | 48 |
| GAY RD | 48 |
| Other | 1,296 |
2002 - 2018 National Fire Incident Reporting System (NFIRS) incidents
- Incident types reported to NFIRS in Puyallup, WA
- 36,80469.5%Rescue & EMS
- 4,3828.3%Fire
- 3,9137.4%Good Intent Call
- 3,1065.9%Service Call
- 2,7825.3%False Alarm
- 1,8673.5%Hazardous Condition
- 760.1%Special Incident
- Fire incident types reported to NFIRS in Puyallup, WA
- 1,75740.1%Structure Fires
- 1,74939.9%Outside Fires
- 62714.3%Mobile Property/Vehicle Fires
- 2495.7%Other
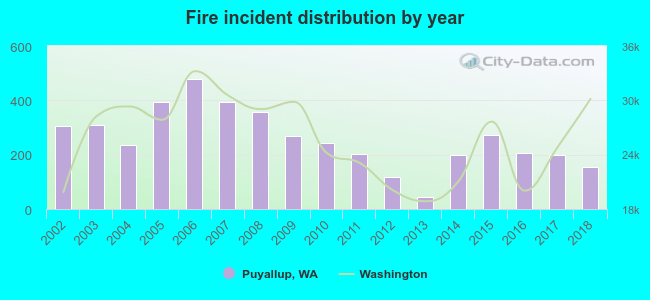 Based on the data from the years 2002 - 2018 the average number of fires per year is 258. The highest number of fire incidents - 479 took place in 2006, and the least - 43 in 2013. The data has a dropping trend.
The average number of yearly fire incidents per 10k residents in Puyallup, WA compared to nearest cities:
(Note: Based on data for the last 3 years, including only cities with population 5,000 and above)
| Puyallup: | 47.5 |
| Sumner: | 73.0 |
| Edgewood: | 24.6 |
| South Hill: | 26.4 |
| Milton: | 38.0 |
| Fife: | 68.8 |
| Bonney Lake: | 67.3 |
| Pacific: | 31.1 |
| Lake Tapps: | 10.1 |
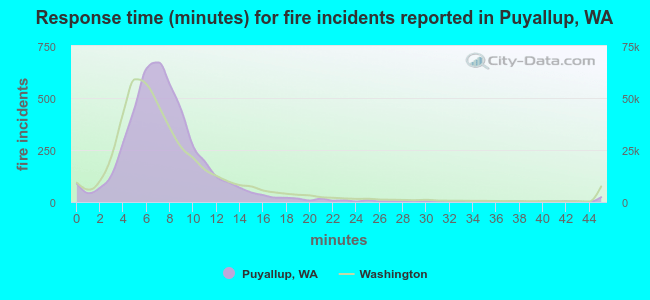 The median response time based on all reported fire incidents is 7 minutes. This is similar to the Washington median value.
The median response time in Puyallup, WA compared to nearest cities:
(Note: Based on data for all years, including only cities with at least 500 fire incidents)
| Puyallup: | 7 minutes |
| Sumner: | 8 minutes |
| Edgewood: | 7 minutes |
| Milton: | 7 minutes |
| Fife: | 5 minutes |
| Bonney Lake: | 8 minutes |
| Orting: | 7 minutes |
| Parkland: | 6 minutes |
| Spanaway: | 7 minutes |
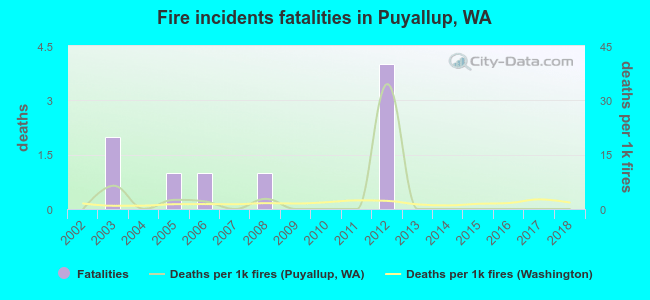 According to the reports from the years 2002 - 2018 the average number of fire-related fatalities per year is 1. The highest number of deaths - 4 took place in 2012, and the lowest - 0 in 2002. The data has a constant trend.
The average number of fatalities per 1,000 fire incidents is 3. This indicator was the highest - 34 in 2012, and the lowest 0 in 2002. The trend for deaths per 1,000 fire incidents is constant. Compared to the state value the number of fatalities per 1,000 fire incidents is higher.
According to the reports from the years 2002 - 2018 the average number of fire-related fatalities per year is 1. The highest number of deaths - 4 took place in 2012, and the lowest - 0 in 2002. The data has a constant trend.
The average number of fatalities per 1,000 fire incidents is 3. This indicator was the highest - 34 in 2012, and the lowest 0 in 2002. The trend for deaths per 1,000 fire incidents is constant. Compared to the state value the number of fatalities per 1,000 fire incidents is higher.
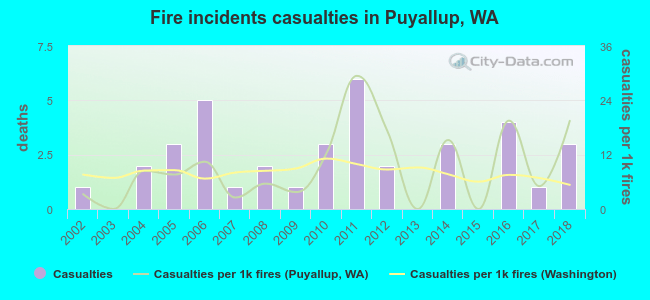 Based on the reports from the years 2002 - 2018 the average number of fire-related yearly casualties is 2. The highest number of injuries - 6 took place in 2011, and the lowest - 0 in 2003. The data has a growing trend.
The average number of injuries per 1,000 fire incidents is 9. This indicator was the highest - 29 in 2011, and the lowest 0 in 2003. The trend for injuries per 1,000 fire incidents is rising. Compared to the state value the number of injuries per 1,000 incidents is about the same.
Based on the reports from the years 2002 - 2018 the average number of fire-related yearly casualties is 2. The highest number of injuries - 6 took place in 2011, and the lowest - 0 in 2003. The data has a growing trend.
The average number of injuries per 1,000 fire incidents is 9. This indicator was the highest - 29 in 2011, and the lowest 0 in 2003. The trend for injuries per 1,000 fire incidents is rising. Compared to the state value the number of injuries per 1,000 incidents is about the same.
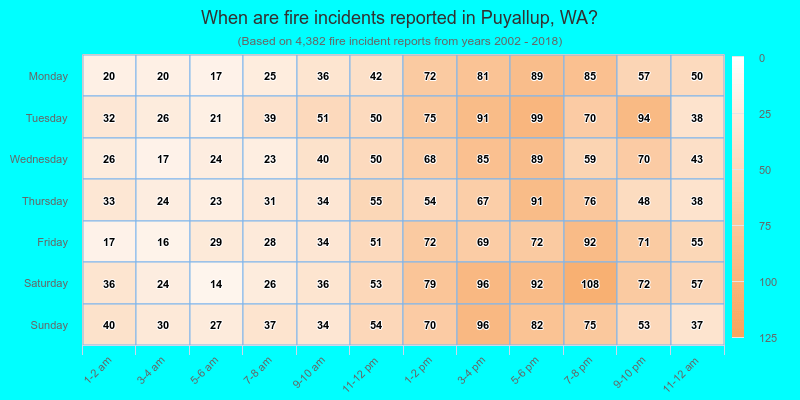
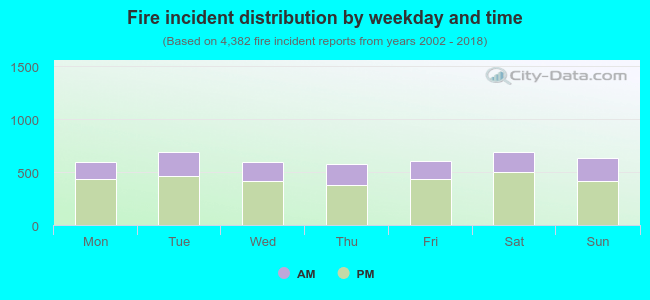 30.7% incidents where reported in the morning and 69.3% in the evening. The most fires (15.8%) took place on Saturday, and the least (13.1%) on Thursday.
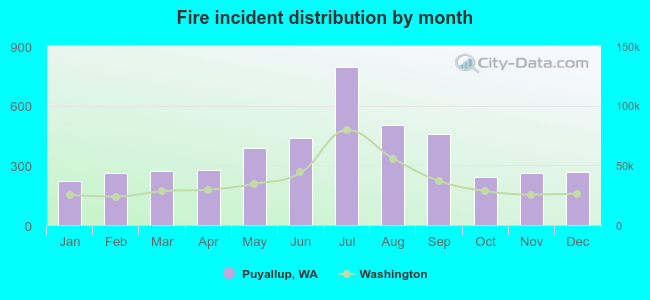 Based on the 4,382 fire incidents from years 2002 - 2018 most fires (18.2%) took place during July, and the least (5.1%) in January.
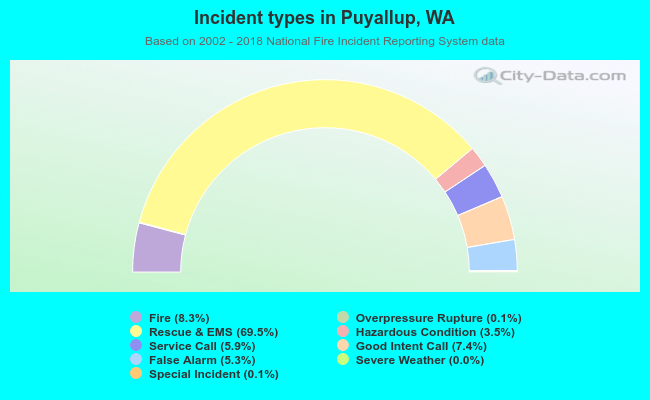 Out of all 52,987 cases reported during the years 2002 - 2018, the most belonged to the categories: Rescue & EMS (69.5%), Fire (8.3%), and Good Intent Call (7.4%).
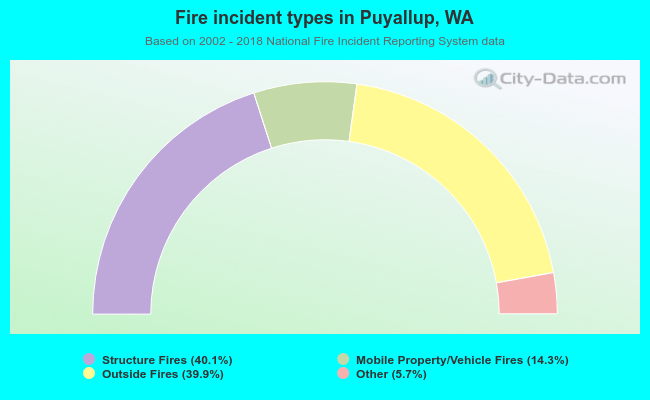 When looking into fire subcategories, the most reports belonged to: Structure Fires (40.1%), and Outside Fires (39.9%).