Kent: Fire Incidents, Washington (WA)
Where are fire incidents reported in Kent, WA
Something went wrong! Please refresh the page.
| Fire incidents reported | |
|---|---|
| Sreet name | Count |
| KENT KANGLEY RD | 546 |
| CENTRAL AVE | 478 |
| 104 AVE | 384 |
| 272 ST | 380 |
| PACIFIC HWY | 328 |
| MEEKER ST | 278 |
| 256 ST | 266 |
| 240 ST | 264 |
| 208 ST | 238 |
| 108 AVE | 228 |
| PACIFIC HY | 212 |
| MILITARY RD | 206 |
| SMITH ST | 200 |
| JAMES ST | 176 |
| WASHINGTON AVE | 176 |
| 88 AVE | 168 |
| RUSSELL RD | 166 |
| 84 AVE | 164 |
| KENT DES MOINES RD | 148 |
| 212 ST | 146 |
| 104TH AVE | 144 |
| 248 ST | 140 |
| 272ND ST | 124 |
| 72 AVE | 122 |
| 132 AVE | 120 |
| BENSON RD | 118 |
| 228 ST | 116 |
| 26 PL | 116 |
| 27 PL | 116 |
| 64 AVE | 106 |
| Other | 3,590 |
2002 - 2018 National Fire Incident Reporting System (NFIRS) incidents
- Incident types reported to NFIRS in Kent, WA
- 57,89065.3%Rescue & EMS
- 9,96411.2%Fire
- 5,4826.2%False Alarm
- 5,4356.1%Good Intent Call
- 5,0955.8%Hazardous Condition
- 3,9854.5%Service Call
- 5820.7%Special Incident
- 1170.1%Overpressure Rupture
- Fire incident types reported to NFIRS in Kent, WA
- 4,04040.5%Outside Fires
- 3,86138.7%Structure Fires
- 1,69217.0%Mobile Property/Vehicle Fires
- 3713.7%Other
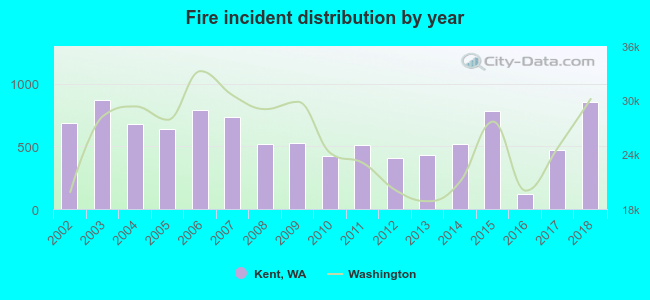 According to the data from the years 2002 - 2018 the average number of fires per year is 586. The highest number of reported fires - 869 took place in 2003, and the least - 117 in 2016. The data has a rising trend.
The average number of yearly fire incidents per 10k residents in Kent, WA compared to nearest cities:
(Note: Based on data for the last 3 years, including only cities with population 5,000 and above)
| Kent: | 38.4 |
| Des Moines: | 41.1 |
| SeaTac: | 44.2 |
| Auburn: | 54.1 |
| Covington: | 17.4 |
| Normandy Park: | 13.1 |
| Tukwila: | 102.1 |
| Federal Way: | 46.6 |
| Renton: | 52.4 |
 The median response time based on all reported fire incidents is 6 minutes. This is about the same as the state median value.
The median response time in Kent, WA compared to nearest cities:
(Note: Based on data for all years, including only cities with at least 500 fire incidents)
| Kent: | 6 minutes |
| Des Moines: | 5 minutes |
| SeaTac: | 5 minutes |
| Auburn: | 6 minutes |
| Covington: | 6 minutes |
| Tukwila: | 6 minutes |
| Federal Way: | 6 minutes |
| Renton: | 6 minutes |
| Burien: | 5 minutes |
 Based on the data from the years 2002 - 2018 the average number of fire-related fatalities per year is 0. The highest number of reported deaths - 1 took place in 2003, and the lowest - 0 in 2002. The data has an increasing trend.
The average number of deaths per 1,000 fires is 0. This indicator was the highest - 2 in 2013, and the lowest 0 in 2002. The trend for deaths per 1,000 fires is increasing. Compared to the Washington value the number of fatalities per 1,000 fires is much lower.
Based on the data from the years 2002 - 2018 the average number of fire-related fatalities per year is 0. The highest number of reported deaths - 1 took place in 2003, and the lowest - 0 in 2002. The data has an increasing trend.
The average number of deaths per 1,000 fires is 0. This indicator was the highest - 2 in 2013, and the lowest 0 in 2002. The trend for deaths per 1,000 fires is increasing. Compared to the Washington value the number of fatalities per 1,000 fires is much lower.
 Based on the data from the years 2002 - 2018 the average number of fire-related yearly casualties is 7. The highest number of reported injuries - 17 took place in 2006, and the lowest - 0 in 2018. The data has a dropping trend.
The average number of casualties per 1,000 fire incidents is 12. This indicator was the highest - 38 in 2010, and the lowest 0 in 2018. The trend for injuries per 1,000 fires is declining. Compared to the Washington value the number of casualties per 1,000 fires is higher.
Based on the data from the years 2002 - 2018 the average number of fire-related yearly casualties is 7. The highest number of reported injuries - 17 took place in 2006, and the lowest - 0 in 2018. The data has a dropping trend.
The average number of casualties per 1,000 fire incidents is 12. This indicator was the highest - 38 in 2010, and the lowest 0 in 2018. The trend for injuries per 1,000 fires is declining. Compared to the Washington value the number of casualties per 1,000 fires is higher.Casualties per 1,000 incidents in Kent, WA compared to nearest cities:
(Note: Based on data for all years, including only cities with at least 500 fire incidents)
| Kent: | 11.6 |
| Des Moines: | 16.0 |
| SeaTac: | 19.7 |
| Auburn: | 9.9 |
| Covington: | 15.6 |
| Tukwila: | 15.6 |
| Federal Way: | 21.1 |
| Renton: | 17.9 |
| Burien: | 14.7 |
 32.7% incidents where reported in the morning and 67.3% in the evening. The most fires (14.9%) took place on Saturday, and the least (13.4%) on Wednesday.
 Based on the 9,964 fires from years 2002 - 2018 most fires (19.6%) took place during July, and the least (5.4%) in February.
 Out of all 88,586 cases reported during the years 2002 - 2018, the most belonged to the categories: Rescue & EMS (65.3%), Fire (11.2%), and False Alarm (6.2%).
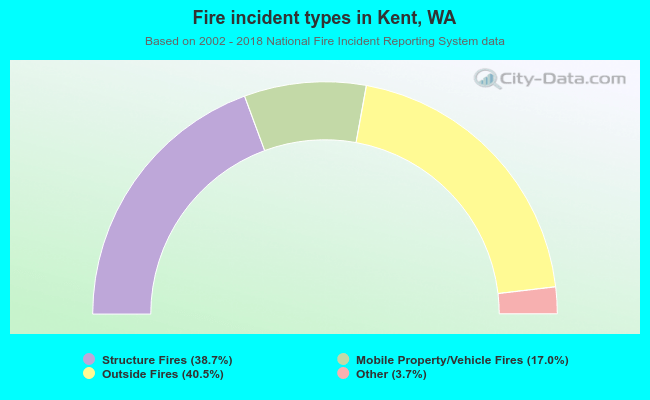 When looking into fire subcategories, the most incidents belonged to: Outside Fires (40.5%), and Structure Fires (38.7%).