Tukwila: Fire Incidents, Washington (WA)
Where are fire incidents reported in Tukwila, WA
Something went wrong! Please refresh the page.
| Fire incidents reported | |
|---|---|
| Sreet name | Count |
| SOUTHCENTER PKY | 384 |
| SOUTHCENTER BLVD | 382 |
| I-5 FWY | 312 |
| ANDOVER PARK | 308 |
| MARGINAL WAY | 276 |
| INTERURBAN AVE | 254 |
| STRANDER BLVD | 254 |
| TUKWILA INTL BLVD | 248 |
| 152 ST | 206 |
| 144 ST | 190 |
| 42 AVE | 186 |
| SOUTHCENTER MALL | 178 |
| I5 FWY | 174 |
| MACADAM RD | 160 |
| VALLEY HWY | 158 |
| 146 ST | 140 |
| MILITARY RD | 134 |
| 51 AVE | 110 |
| 37 AVE | 104 |
| TUKWILA INTERNATIONA BLVD | 102 |
| 180 ST | 94 |
| 53 AVE | 92 |
| INDUSTRY DR | 84 |
| ORILLIA RD | 84 |
| 56 AVE | 82 |
| 150 ST | 74 |
| 34 AVE | 72 |
| 148 ST | 68 |
| SR 518 FWY | 66 |
| 39 PL | 64 |
2002 - 2018 National Fire Incident Reporting System (NFIRS) incidents
- Incident types reported to NFIRS in Tukwila, WA
- 12,51550.8%Rescue & EMS
- 3,83715.6%Fire
- 3,40613.8%False Alarm
- 1,9828.0%Hazardous Condition
- 1,9257.8%Good Intent Call
- 8533.5%Service Call
- 880.4%Special Incident
- 310.1%Overpressure Rupture
- Fire incident types reported to NFIRS in Tukwila, WA
- 1,57241.0%Structure Fires
- 86022.4%Mobile Property/Vehicle Fires
- 79020.6%Outside Fires
- 61516.0%Other
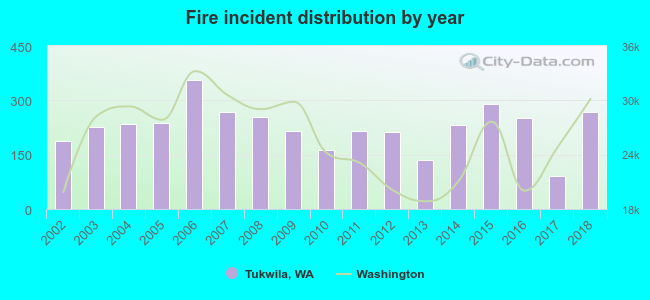 According to the data from the years 2002 - 2018 the average number of fire incidents per year is 226. The highest number of fire incidents - 355 took place in 2006, and the least - 91 in 2017. The data has an increasing trend.
The average number of yearly fire incidents per 10k residents in Tukwila, WA compared to nearest cities:
(Note: Based on data for the last 3 years, including only cities with population 5,000 and above)
| Tukwila: | 102.1 |
| SeaTac: | 44.2 |
| Burien: | 39.4 |
| Renton: | 52.4 |
| Normandy Park: | 13.1 |
| Newcastle: | 17.9 |
| Des Moines: | 41.1 |
| Mercer Island: | 12.1 |
| Kent: | 38.4 |
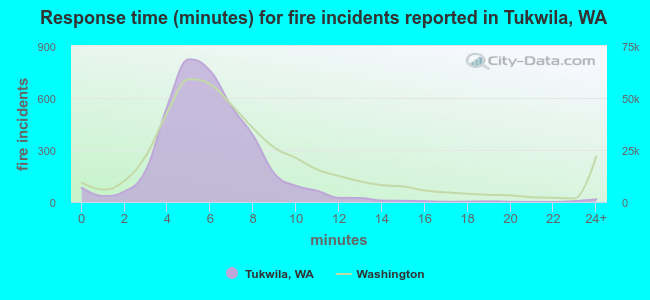 The median response time based on all reported fire incidents is 6 minutes. This is comparable to the state median value.
The median response time in Tukwila, WA compared to nearest cities:
(Note: Based on data for all years, including only cities with at least 500 fire incidents)
| Tukwila: | 6 minutes |
| SeaTac: | 5 minutes |
| Burien: | 5 minutes |
| Renton: | 6 minutes |
| Des Moines: | 5 minutes |
| Mercer Island: | 6 minutes |
| Kent: | 6 minutes |
| Bellevue: | 6 minutes |
| Vashon: | 8 minutes |
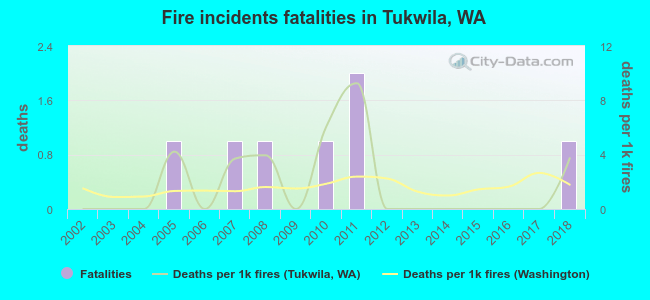 According to the reports from the years 2002 - 2018 the average number of fire-related fatalities per year is 0. The highest number of deaths - 2 took place in 2011, and the lowest - 0 in 2002. The data has a rising trend.
The average number of fatalities per 1,000 fire incidents is 2. This indicator was the highest - 9 in 2011, and the lowest 0 in 2002. The trend for fatalities per 1,000 fire incidents is increasing. Compared to the Washington value the number of fatalities per 1,000 fire incidents is similar.
According to the reports from the years 2002 - 2018 the average number of fire-related fatalities per year is 0. The highest number of deaths - 2 took place in 2011, and the lowest - 0 in 2002. The data has a rising trend.
The average number of fatalities per 1,000 fire incidents is 2. This indicator was the highest - 9 in 2011, and the lowest 0 in 2002. The trend for fatalities per 1,000 fire incidents is increasing. Compared to the Washington value the number of fatalities per 1,000 fire incidents is similar.
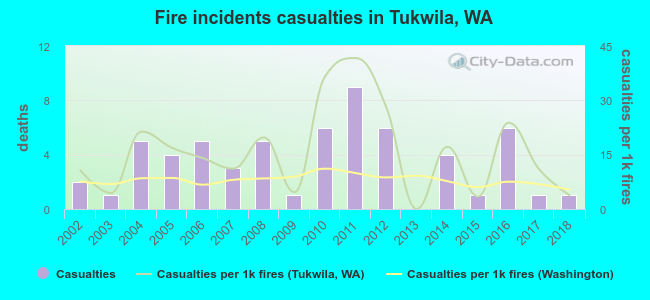 According to the reports from the years 2002 - 2018 the average number of fire-related casualties per year is 4. The highest number of reported casualties - 9 took place in 2011, and the lowest - 0 in 2013. The data has a declining trend.
The average number of casualties per 1,000 fire incidents is 16. This indicator was the highest - 42 in 2011, and the lowest 0 in 2013. The trend for casualties per 1,000 fire incidents is dropping. Compared to the Washington value the number of injuries per 1,000 fire incidents is higher.
According to the reports from the years 2002 - 2018 the average number of fire-related casualties per year is 4. The highest number of reported casualties - 9 took place in 2011, and the lowest - 0 in 2013. The data has a declining trend.
The average number of casualties per 1,000 fire incidents is 16. This indicator was the highest - 42 in 2011, and the lowest 0 in 2013. The trend for casualties per 1,000 fire incidents is dropping. Compared to the Washington value the number of injuries per 1,000 fire incidents is higher.Casualties per 1,000 incidents in Tukwila, WA compared to nearest cities:
(Note: Based on data for all years, including only cities with at least 500 fire incidents)
| Tukwila: | 15.6 |
| SeaTac: | 19.7 |
| Burien: | 14.7 |
| Renton: | 17.9 |
| Des Moines: | 16.0 |
| Mercer Island: | 5.4 |
| Kent: | 11.6 |
| Bellevue: | 11.9 |
| Vashon: | 3.2 |
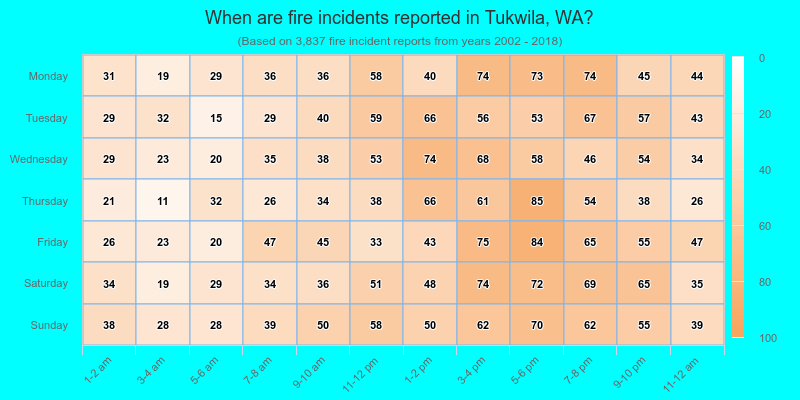
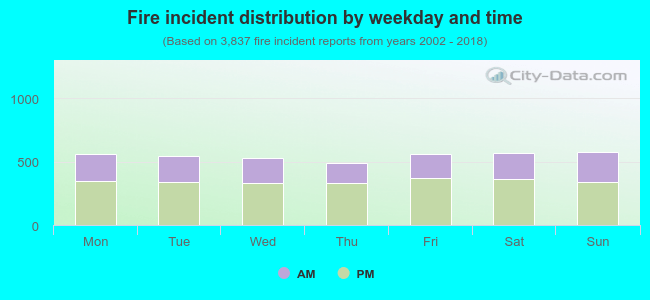 36.8% incidents where reported in the morning and 63.2% in the evening. The most fires (15.1%) took place on Sunday, and the least (12.8%) on Thursday.
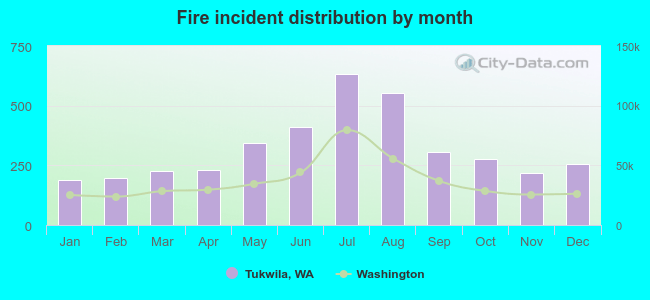 Based on the 3,837 fire incidents from years 2002 - 2018 most fires (16.5%) took place during July, and the least (4.9%) in January.
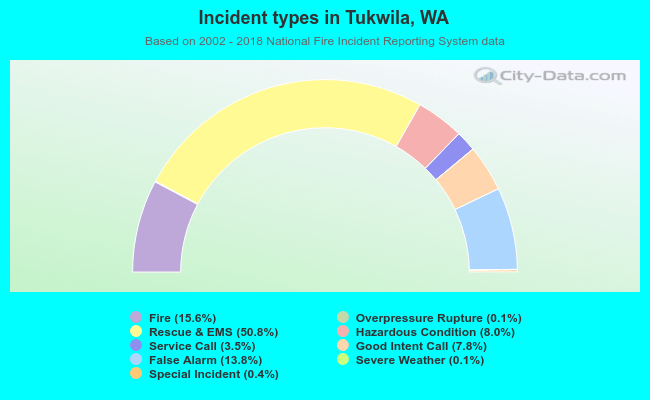 Out of all 24,653 cases reported during the years 2002 - 2018, the most belonged to the categories: Rescue & EMS (50.8%), Fire (15.6%), and False Alarm (13.8%).
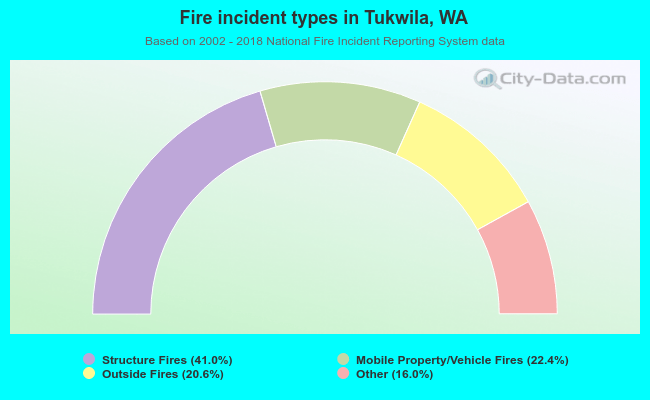 When looking into fire subcategories, the most incidents belonged to: Structure Fires (41.0%), and Mobile Property/Vehicle Fires (22.4%).