Victorville: Fire Incidents, California (CA)
Where are fire incidents reported in Victorville, CA
Something went wrong! Please refresh the page.
| Fire incidents reported | |
|---|---|
| Sreet name | Count |
| BEAR VALLEY RD | 142 |
| SEVENTH ST | 90 |
| PALMDALE RD | 88 |
| STODDARD WELLS RD | 68 |
| SENECA RD | 66 |
| HESPERIA RD | 64 |
| D ST | 62 |
| LA PAZ DR | 52 |
| MARIPOSA RD | 50 |
| AMARGOSA RD | 48 |
| NISQUALLI RD | 42 |
| MOJAVE DR | 40 |
| COBALT RD | 32 |
| EL EVADO RD | 32 |
| VILLAGE DR | 32 |
| GREEN TREE BLVD | 28 |
| BEGONIA RD | 26 |
| HOOK BLVD | 26 |
| RODEO DR | 24 |
| INTERSTATE 15 FWY | 22 |
| SHAY RD | 22 |
| READINESS ST | 20 |
| HIGHWAY 395 HWY | 18 |
| JASMINE ST | 18 |
| LA MESA RD | 18 |
| SIXTH ST | 18 |
| 7TH ST | 16 |
| DOS PALMAS RD | 16 |
| FIRST AVE | 16 |
| LUNA RD | 16 |
| Other | 478 |
2006 - 2018 National Fire Incident Reporting System (NFIRS) incidents
- Incident types reported to NFIRS in Victorville, CA
- 21,78566.9%Rescue & EMS
- 6,46919.9%Good Intent Call
- 1,6905.2%Fire
- 1,1123.4%Service Call
- 7782.4%Hazardous Condition
- 7202.2%False Alarm
- Fire incident types reported to NFIRS in Victorville, CA
- 80147.4%Outside Fires
- 53231.5%Structure Fires
- 30217.9%Mobile Property/Vehicle Fires
- 553.3%Other
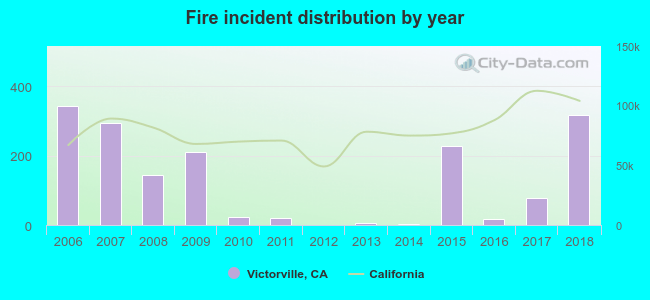 According to the data from the years 2006 - 2018 the average number of fires per year is 130. The highest number of fires - 344 took place in 2006, and the least - 0 in 2012. The data has a dropping trend.
The average number of yearly fire incidents per 10k residents in Victorville, CA compared to nearest cities:
(Note: Based on data for the last 3 years, including only cities with population 5,000 and above)
| Victorville: | 11.2 |
| Spring Valley Lake: | 4.1 |
| Adelanto: | 16.2 |
| Apple Valley: | 8.1 |
| Hesperia: | 10.4 |
| Oak Hills: | 2.8 |
| Phelan: | 32.6 |
| Pinon Hills: | 11.0 |
| Crestline: | 13.3 |
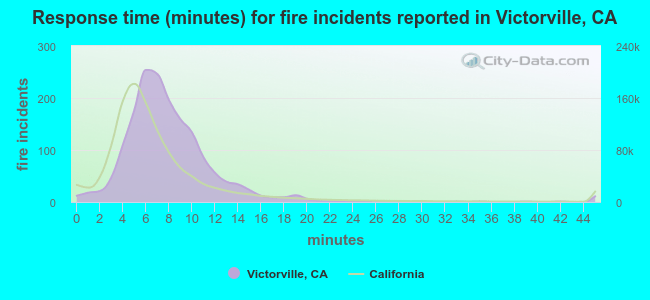 The median response time based on all reported fire incidents is 7 minutes. This is close to the state median value.
The median response time in Victorville, CA compared to nearest cities:
(Note: Based on data for all years, including only cities with at least 500 fire incidents)
| Victorville: | 7 minutes |
| Apple Valley: | 7 minutes |
| Hesperia: | 8 minutes |
| San Bernardino: | 7 minutes |
| Rialto: | 8 minutes |
| Lake Los Angeles: | 6 minutes |
| Fontana: | 7 minutes |
| Rancho Cucamonga: | 7 minutes |
| Colton: | 7 minutes |
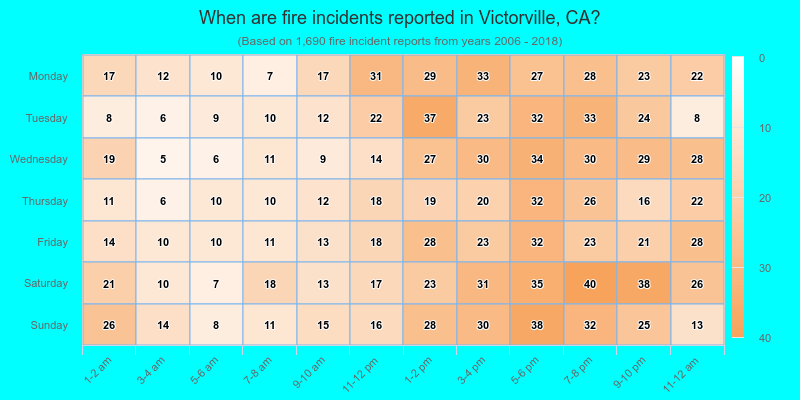
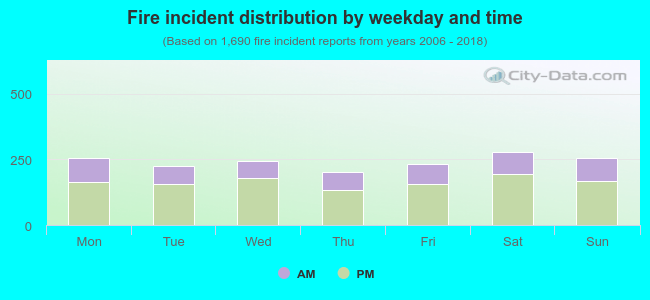 32.2% incidents where reported in the morning and 67.8% in the evening. The most fires (16.5%) took place on Saturday, and the least (12.0%) on Thursday.
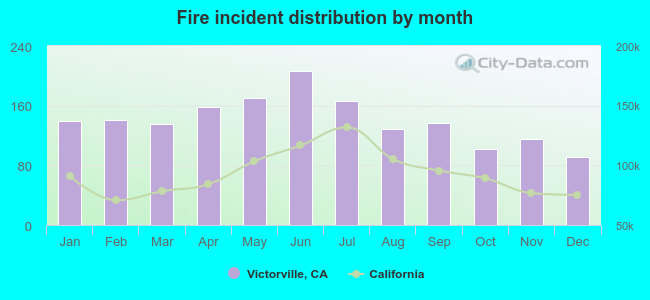 According to the 1,690 fire incidents from years 2006 - 2018 most fires (12.2%) took place during June, and the least (5.4%) in December.
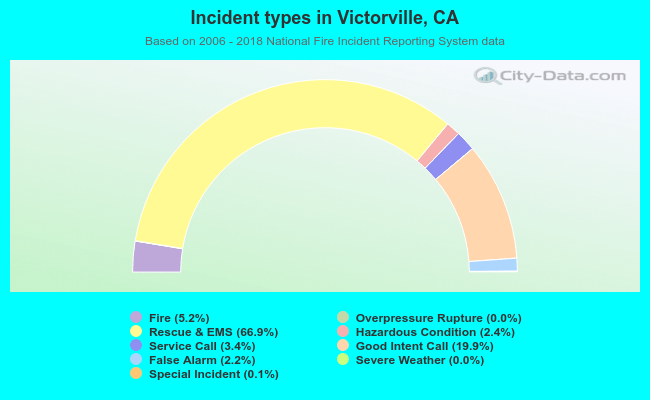 Out of all 32,587 cases reported during the years 2006 - 2018, the most belonged to the categories: Rescue & EMS (66.9%), Good Intent Call (19.9%), and Fire (5.2%).
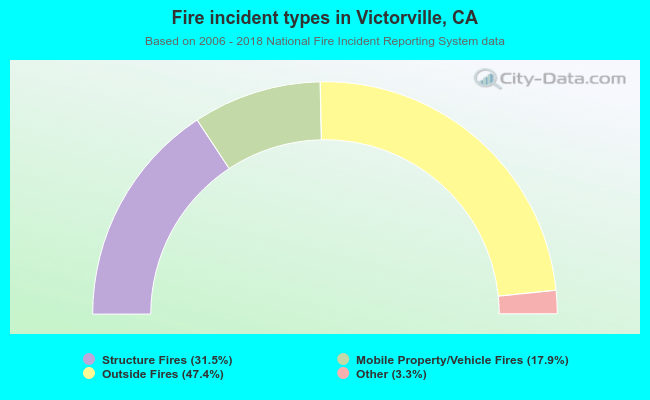 When looking into fire subcategories, the most incidents belonged to: Outside Fires (47.4%), and Structure Fires (31.5%).