Rialto: Fire Incidents, California (CA)
Where are fire incidents reported in Rialto, CA
Something went wrong! Please refresh the page.
|
| |||||||||||||||||||||||||||||||||||||||||||||||||||||||||||||||||||||||||||||||||||||||||||||||||||||||||||||
2005 - 2018 National Fire Incident Reporting System (NFIRS) incidents
- Incident types reported to NFIRS in Rialto, CA
- 75230.4%Rescue & EMS
- 63125.5%Fire
- 60524.4%Good Intent Call
- 28211.4%Hazardous Condition
- 1465.9%Service Call
- 512.1%False Alarm
- 40.2%Special Incident
- Fire incident types reported to NFIRS in Rialto, CA
- 23637.4%Outside Fires
- 22435.5%Structure Fires
- 14923.6%Mobile Property/Vehicle Fires
- 223.5%Other
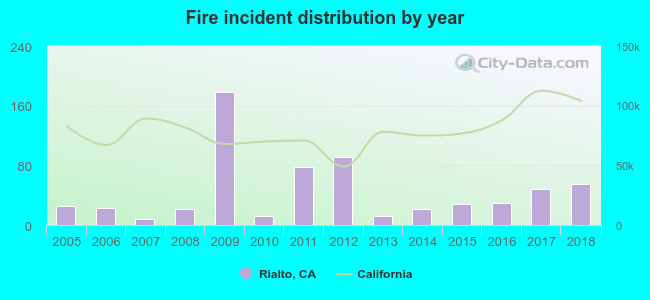 According to the data from the years 2005 - 2018 the average number of fires per year is 45. The highest number of reported fires - 178 took place in 2009, and the least - 8 in 2007. The data has a growing trend.
The average number of yearly fire incidents per 10k residents in Rialto, CA compared to nearest cities:
(Note: Based on data for the last 3 years, including only cities with population 5,000 and above)
| Rialto: | 4.3 |
| Muscoy: | 21.0 |
| Bloomington: | 11.2 |
| Fontana: | 8.5 |
| Colton: | 60.0 |
| San Bernardino: | 22.7 |
| Grand Terrace: | 8.3 |
| Rubidoux: | 1.3 |
| Loma Linda: | 30.9 |
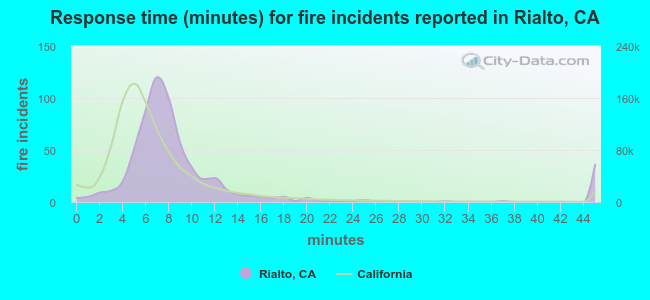 The median response time based on all reported fire incidents is 8 minutes. This is higher than the California median value.
The median response time in Rialto, CA compared to nearest cities:
(Note: Based on data for all years, including only cities with at least 500 fire incidents)
| Rialto: | 8 minutes |
| Fontana: | 7 minutes |
| Colton: | 7 minutes |
| San Bernardino: | 7 minutes |
| Loma Linda: | 6 minutes |
| Rancho Cucamonga: | 7 minutes |
| Riverside: | 6 minutes |
| Redlands: | 6 minutes |
| Ontario: | 6 minutes |
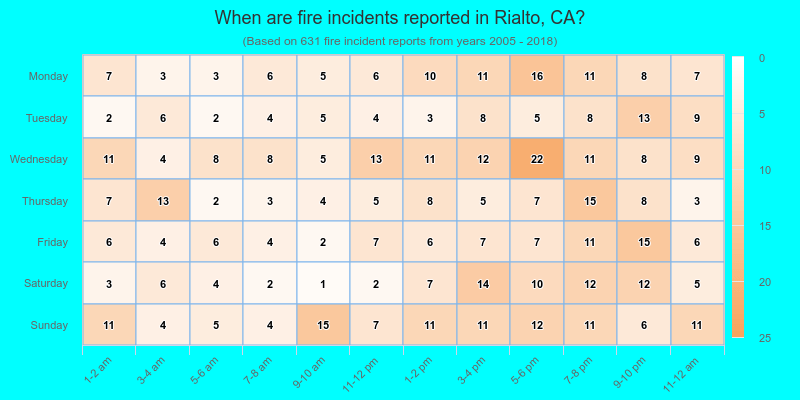
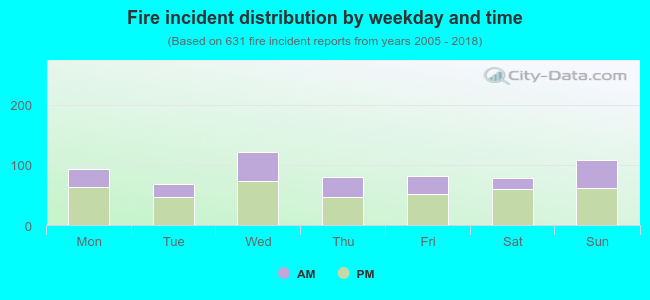 36.3% incidents where reported in the morning and 63.7% in the evening. The most fires (19.3%) took place on Wednesday, and the least (10.9%) on Tuesday.
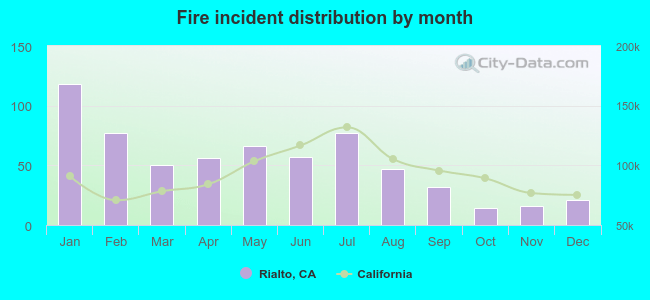 According to the 631 fire incidents from years 2005 - 2018 most fires (18.7%) took place during January, and the least (2.2%) in October.
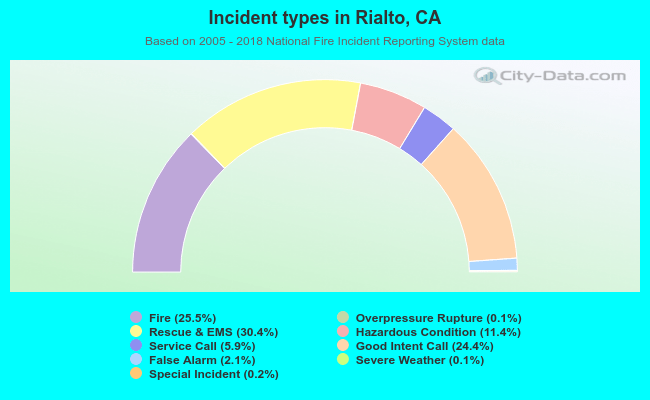 Out of all 2,475 cases reported during the years 2005 - 2018, the most belonged to the categories: Rescue & EMS (30.4%), Fire (25.5%), and Good Intent Call (24.4%).
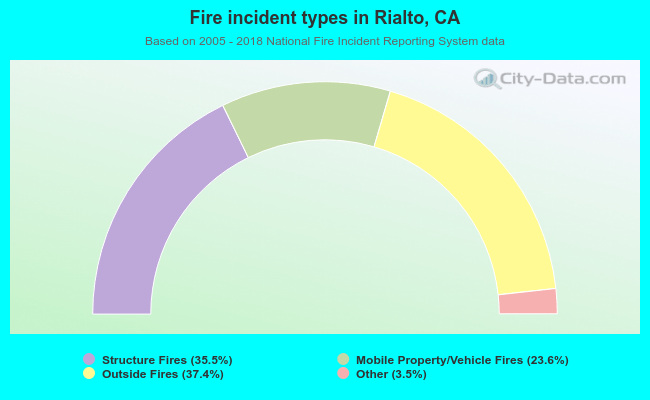 When looking into fire subcategories, the most reports belonged to: Outside Fires (37.4%), and Structure Fires (35.5%).