Rancho Cucamonga: Fire Incidents, California (CA)
Where are fire incidents reported in Rancho Cucamonga, CA
Something went wrong! Please refresh the page.
| Fire incidents reported | |
|---|---|
| Sreet name | Count |
| FOOTHILL BLVD | 208 |
| HAVEN AVE | 150 |
| BASELINE RD | 118 |
| CHURCH ST | 116 |
| ARCHIBALD AVE | 100 |
| STATE 210 FWY | 90 |
| ETIWANDA AVE | 82 |
| MILLIKEN AVE | 70 |
| FOOTHILL BL | 68 |
| ARROW RTE | 66 |
| ARROW | 64 |
| 19TH ST | 60 |
| VINEYARD AVE | 50 |
| FOURTH ST | 48 |
| ARROW RT | 44 |
| 6TH ST | 40 |
| DAY CREEK BLVD | 36 |
| CARNELIAN ST | 34 |
| I15 NB OFR AT FOOTHI | 34 |
| LEMON AVE | 34 |
| 9TH ST | 32 |
| AMETHYST ST | 32 |
| HERMOSA AVE | 32 |
| VICTORIA ST | 32 |
| HELLMAN AVE | 30 |
| 8TH ST | 26 |
| BASE LINE RD | 24 |
| GROVE AVE | 24 |
| ARCHIBALD AV | 22 |
| HAVEN AV | 22 |
| Other | 844 |
2005 - 2018 National Fire Incident Reporting System (NFIRS) incidents
- Incident types reported to NFIRS in Rancho Cucamonga, CA
- 40,50769.4%Rescue & EMS
- 7,32512.6%Good Intent Call
- 4,0426.9%Service Call
- 2,6324.5%Fire
- 2,1183.6%False Alarm
- 1,6152.8%Hazardous Condition
- 640.1%Overpressure Rupture
- Fire incident types reported to NFIRS in Rancho Cucamonga, CA
- 1,05840.2%Outside Fires
- 92235.0%Structure Fires
- 57721.9%Mobile Property/Vehicle Fires
- 752.8%Other
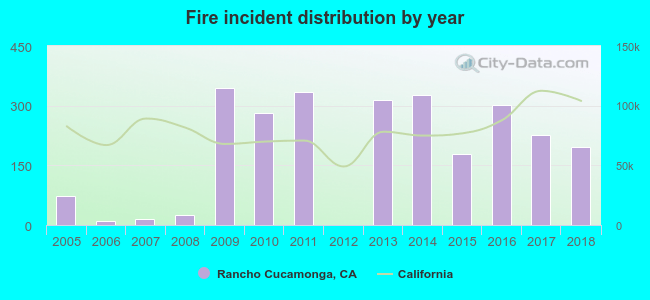 Based on the data from the years 2005 - 2018 the average number of fires per year is 188. The highest number of reported fires - 345 took place in 2009, and the least - 1 in 2012. The data has an increasing trend.
The average number of yearly fire incidents per 10k residents in Rancho Cucamonga, CA compared to nearest cities:
(Note: Based on data for the last 3 years, including only cities with population 5,000 and above)
| Rancho Cucamonga: | 13.9 |
| Upland: | 6.6 |
| Ontario: | 9.3 |
| Fontana: | 8.5 |
| Montclair: | 3.8 |
| Claremont: | 16.7 |
| Chino: | 11.2 |
| Jurupa: | 0.1 |
| Pomona: | 27.8 |
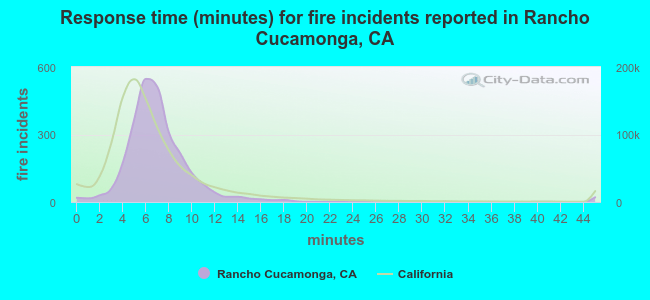 The median response time based on all reported fire incidents is 7 minutes. This is about the same as the California median value.
The median response time in Rancho Cucamonga, CA compared to nearest cities:
(Note: Based on data for all years, including only cities with at least 500 fire incidents)
| Rancho Cucamonga: | 7 minutes |
| Ontario: | 6 minutes |
| Fontana: | 7 minutes |
| Montclair: | 6 minutes |
| Claremont: | 5 minutes |
| Chino: | 6 minutes |
| Pomona: | 5 minutes |
| La Verne: | 5 minutes |
| Rialto: | 8 minutes |
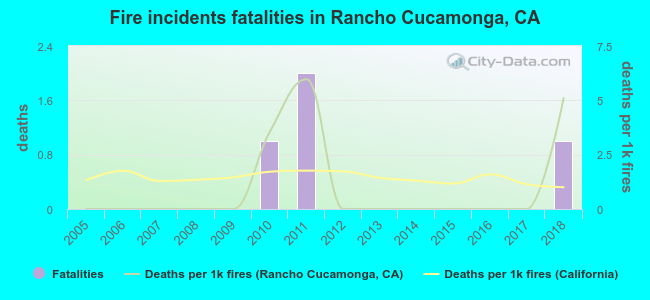 Based on the data from the years 2005 - 2018 the average number of fire-related yearly deaths is 0. The highest number of deaths - 2 took place in 2011, and the lowest - 0 in 2005. The data has a rising trend.
The average number of deaths per 1,000 fire incidents is 1. This indicator was the highest - 6 in 2011, and the lowest 0 in 2005. The trend for deaths per 1,000 fire incidents is growing. Compared to the California value the number of fatalities per 1,000 incidents is about the same.
Based on the data from the years 2005 - 2018 the average number of fire-related yearly deaths is 0. The highest number of deaths - 2 took place in 2011, and the lowest - 0 in 2005. The data has a rising trend.
The average number of deaths per 1,000 fire incidents is 1. This indicator was the highest - 6 in 2011, and the lowest 0 in 2005. The trend for deaths per 1,000 fire incidents is growing. Compared to the California value the number of fatalities per 1,000 incidents is about the same.
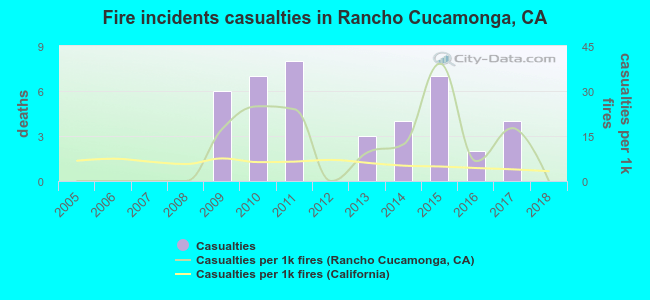 Based on the data from the years 2005 - 2018 the average number of fire-related casualties per year is 3. The highest number of reported injuries - 8 took place in 2011, and the lowest - 0 in 2005. The data has a constant trend.
The average number of casualties per 1,000 fire incidents is 11. This indicator was the highest - 39 in 2015, and the lowest 0 in 2005. The trend for casualties per 1,000 fire incidents is constant. Compared to the state value the number of casualties per 1,000 fire incidents is much higher.
Based on the data from the years 2005 - 2018 the average number of fire-related casualties per year is 3. The highest number of reported injuries - 8 took place in 2011, and the lowest - 0 in 2005. The data has a constant trend.
The average number of casualties per 1,000 fire incidents is 11. This indicator was the highest - 39 in 2015, and the lowest 0 in 2005. The trend for casualties per 1,000 fire incidents is constant. Compared to the state value the number of casualties per 1,000 fire incidents is much higher.
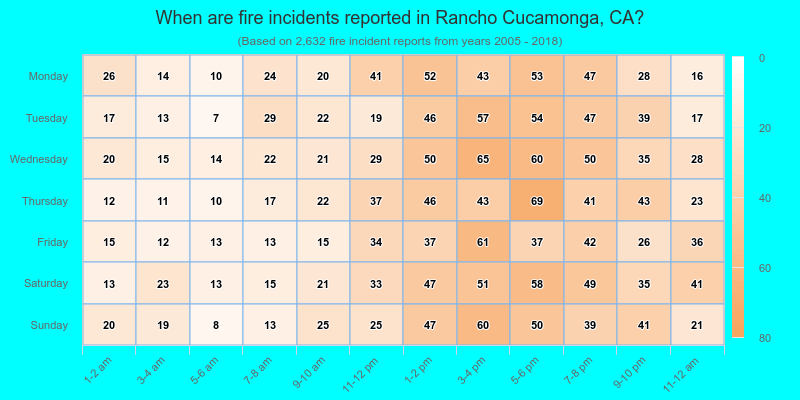
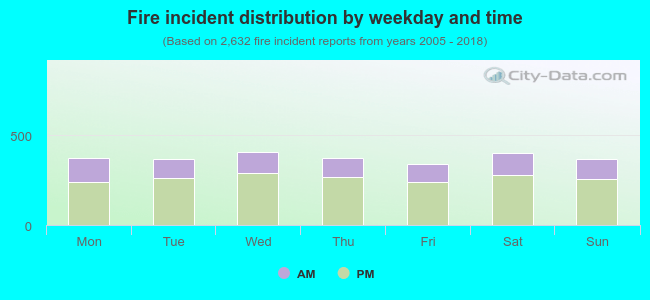 30.5% incidents where reported in the morning and 69.5% in the evening. The most fires (15.5%) took place on Wednesday, and the least (13.0%) on Friday.
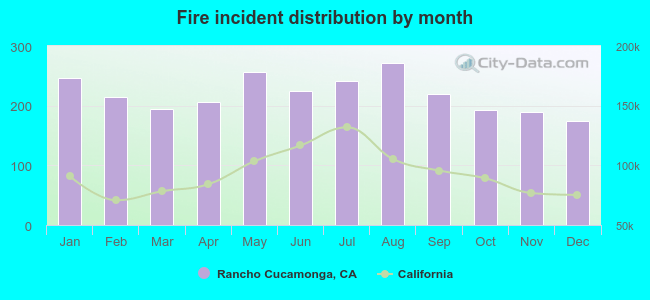 According to the 2,632 fire incident reports from years 2005 - 2018 most fires (10.3%) took place during August, and the least (6.6%) in December.
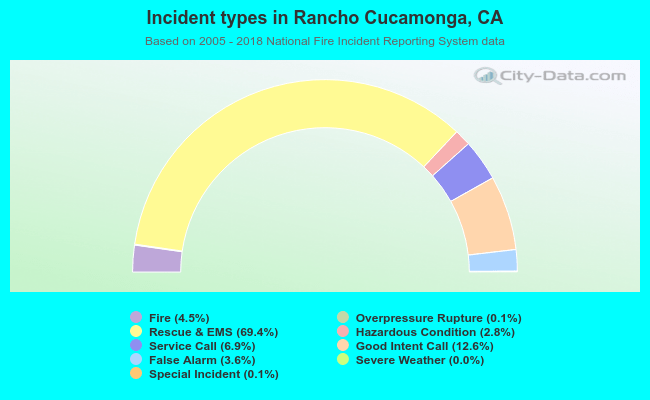 Out of all 58,361 cases reported during the years 2005 - 2018, the most belonged to the categories: Rescue & EMS (69.4%), Good Intent Call (12.6%), and Service Call (6.9%).
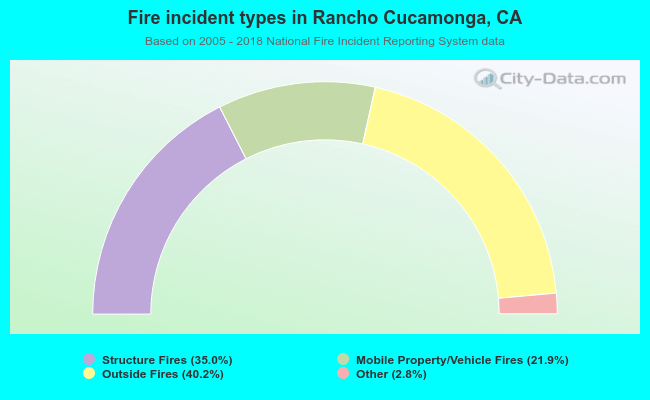 When looking into fire subcategories, the most incidents belonged to: Outside Fires (40.2%), and Structure Fires (35.0%).