Upland: Fire Incidents, California (CA)
Where are fire incidents reported in Upland, CA
Something went wrong! Please refresh the page.
|
| |||||||||||||||||||||||||||||||||||||||||||||||||||||||||||||||||||||||||||||||||||||||||||||||||||||||||||||
2005 - 2018 National Fire Incident Reporting System (NFIRS) incidents
- Incident types reported to NFIRS in Upland, CA
- 7,96069.3%Rescue & EMS
- 2,03117.7%Good Intent Call
- 4834.2%Service Call
- 4804.2%Fire
- 2862.5%False Alarm
- 2412.1%Hazardous Condition
- Fire incident types reported to NFIRS in Upland, CA
- 24751.5%Structure Fires
- 11624.2%Outside Fires
- 10020.8%Mobile Property/Vehicle Fires
- 173.5%Other
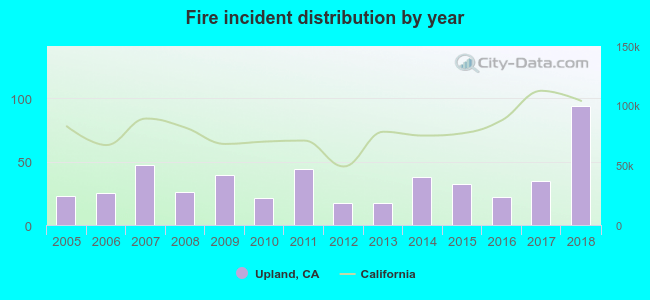 Based on the data from the years 2005 - 2018 the average number of fires per year is 34. The highest number of reported fires - 94 took place in 2018, and the least - 17 in 2012. The data has a growing trend.
The average number of yearly fire incidents per 10k residents in Upland, CA compared to nearest cities:
(Note: Based on data for the last 3 years, including only cities with population 5,000 and above)
| Upland: | 6.6 |
| Claremont: | 16.7 |
| Montclair: | 3.8 |
| Ontario: | 9.3 |
| Rancho Cucamonga: | 13.9 |
| La Verne: | 17.0 |
| Pomona: | 27.8 |
| Chino: | 11.2 |
| San Dimas: | 14.6 |
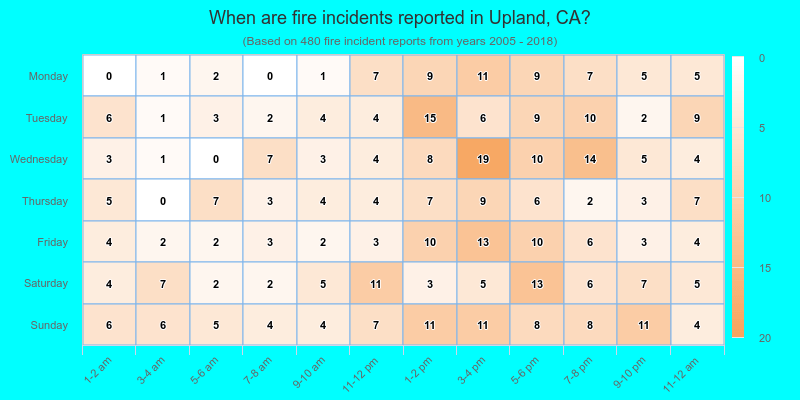
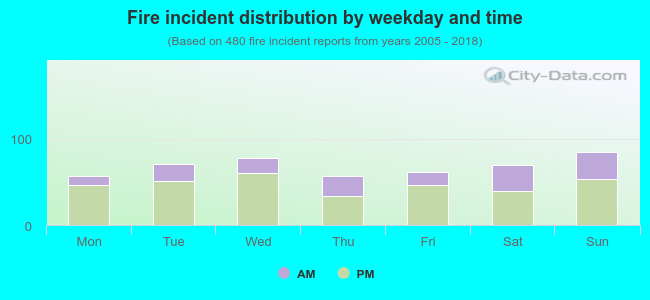 31.5% incidents where reported in the morning and 68.5% in the evening. The most fires (17.7%) took place on Sunday, and the least (11.9%) on Monday.
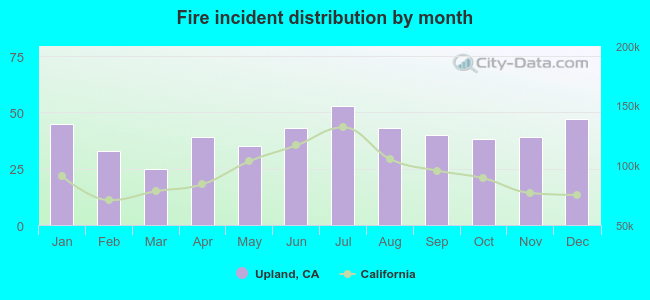 Based on the 480 fire incident reports from years 2005 - 2018 most fires (11.0%) took place during July, and the least (5.2%) in March.
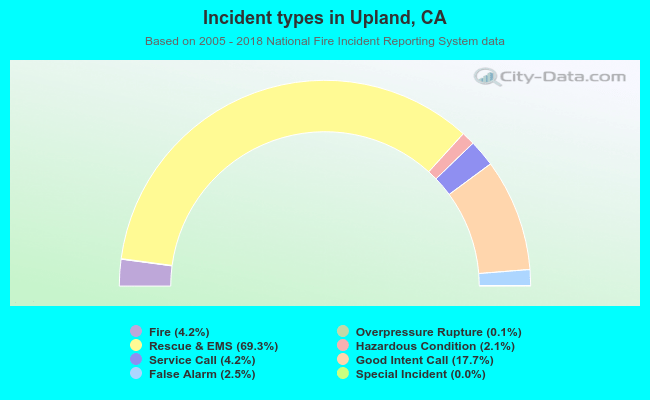 Out of all 11,494 cases reported during the years 2005 - 2018, the most belonged to the categories: Rescue & EMS (69.3%), Good Intent Call (17.7%), and Service Call (4.2%).
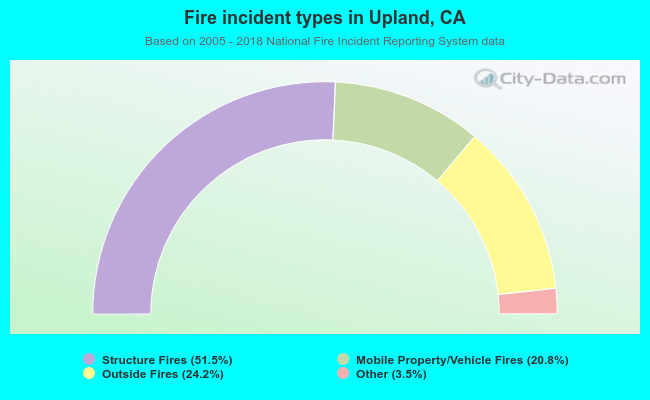 When looking into fire subcategories, the most incidents belonged to: Structure Fires (51.5%), and Outside Fires (24.2%).