Crestline: Fire Incidents, California (CA)
Where are fire incidents reported in Crestline, CA
Something went wrong! Please refresh the page.
|
| |||||||||||||||||||||||||||||||||||||||||||||||||||||||||||||||||||||||||||||||||||||||||||||||||||||||||||||
2005 - 2018 National Fire Incident Reporting System (NFIRS) incidents
- Incident types reported to NFIRS in Crestline, CA
- 1,15253.3%Rescue & EMS
- 25811.9%Good Intent Call
- 23110.7%Hazardous Condition
- 2019.3%Fire
- 1627.5%Service Call
- 1476.8%False Alarm
- 100.5%Special Incident
- Fire incident types reported to NFIRS in Crestline, CA
- 9145.3%Structure Fires
- 6532.3%Outside Fires
- 4220.9%Mobile Property/Vehicle Fires
- 31.5%Other
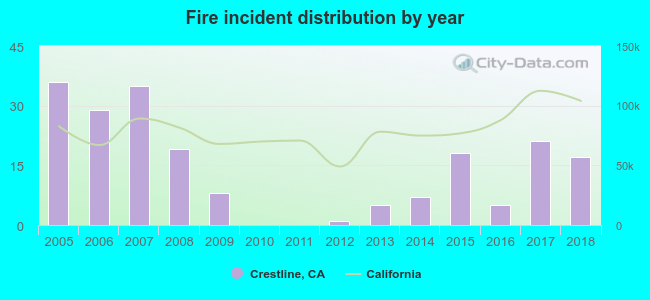 Based on the data from the years 2005 - 2018 the average number of fires per year is 14. The highest number of reported fire incidents - 36 took place in 2005, and the least - 0 in 2010. The data has a declining trend.
The average number of yearly fire incidents per 10k residents in Crestline, CA compared to nearest cities:
(Note: Based on data for the last 3 years, including only cities with population 5,000 and above)
| Crestline: | 13.3 |
| Lake Arrowhead: | 6.7 |
| Muscoy: | 21.0 |
| San Bernardino: | 22.7 |
| Highland: | 2.4 |
| Rialto: | 4.3 |
| Hesperia: | 10.4 |
| Oak Hills: | 2.8 |
| Colton: | 60.0 |
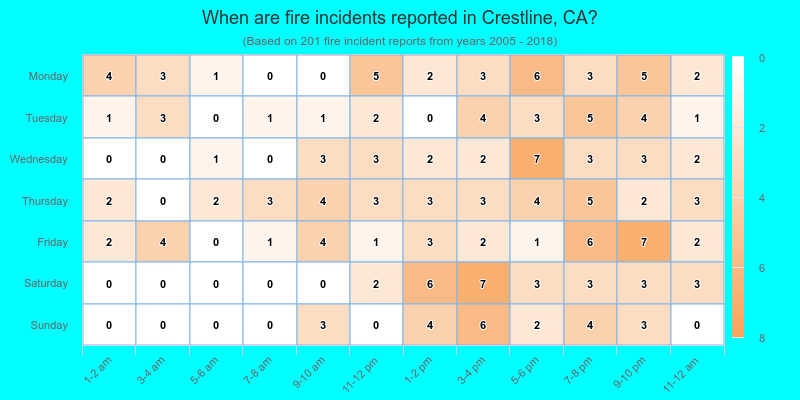
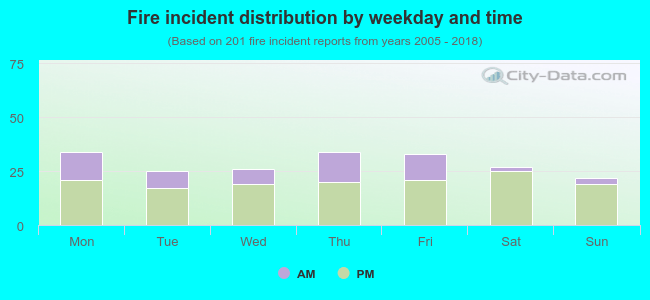 29.4% incidents where reported in the morning and 70.6% in the evening. The most fires (16.9%) took place on Monday, and the least (10.9%) on Sunday.
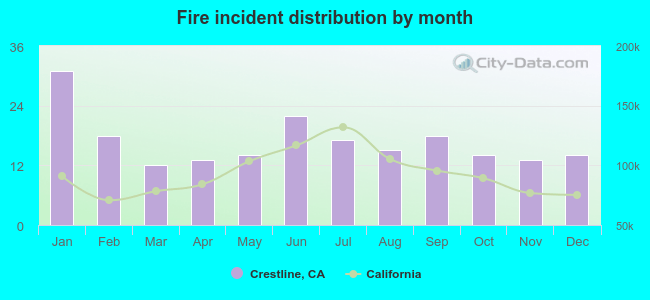 According to the 201 fire incident reports from years 2005 - 2018 most fires (15.4%) took place during January, and the least (6.0%) in March.
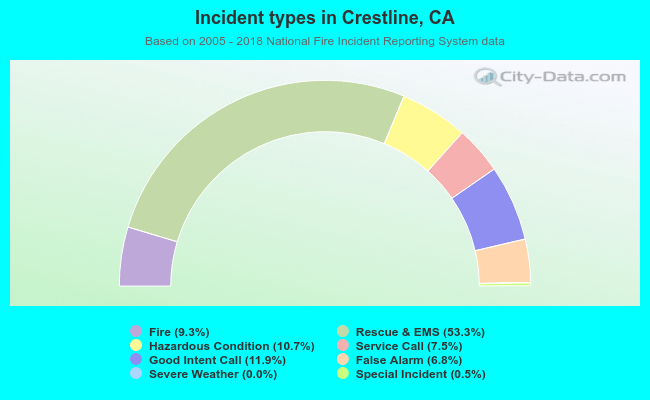 Out of all 2,162 cases reported during the years 2005 - 2018, the most belonged to the categories: Overpressure Rupture (53.3%), Service Call (11.9%), and Rescue & EMS (10.7%).
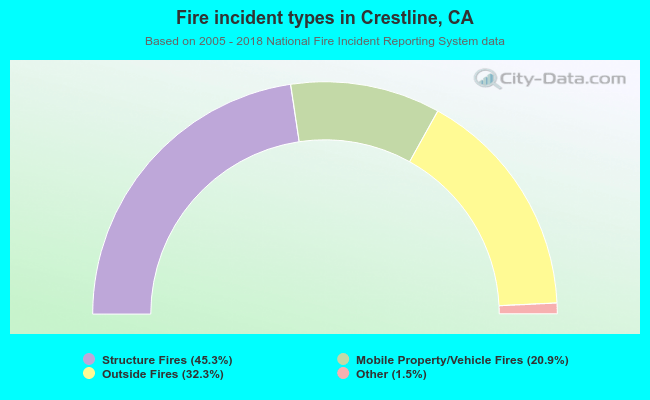 When looking into fire subcategories, the most reports belonged to: Structure Fires (45.3%), and Outside Fires (32.3%).