Hesperia: Fire Incidents, California (CA)
Where are fire incidents reported in Hesperia, CA
Something went wrong! Please refresh the page.
|
| |||||||||||||||||||||||||||||||||||||||||||||||||||||||||||||||||||||||||||||||||||||||||||||||||||||||||||||
| Other | 63 | |||||||||||||||||||||||||||||||||||||||||||||||||||||||||||||||||||||||||||||||||||||||||||||||||||||||||||||
2005 - 2018 National Fire Incident Reporting System (NFIRS) incidents
- Incident types reported to NFIRS in Hesperia, CA
- 13,92577.7%Rescue & EMS
- 1,3857.7%Good Intent Call
- 1,0075.6%Service Call
- 7214.0%Fire
- 4952.8%Hazardous Condition
- 3381.9%False Alarm
- 380.2%Special Incident
- Fire incident types reported to NFIRS in Hesperia, CA
- 33446.3%Outside Fires
- 20728.7%Structure Fires
- 15922.1%Mobile Property/Vehicle Fires
- 212.9%Other
 According to the data from the years 2005 - 2018 the average number of fires per year is 52. The highest number of fire incidents - 203 took place in 2018, and the least - 0 in 2012. The data has a rising trend.
The average number of yearly fire incidents per 10k residents in Hesperia, CA compared to nearest cities:
(Note: Based on data for the last 3 years, including only cities with population 5,000 and above)
| Hesperia: | 10.4 |
| Oak Hills: | 2.8 |
| Spring Valley Lake: | 4.1 |
| Victorville: | 11.2 |
| Apple Valley: | 8.1 |
| Crestline: | 13.3 |
| Lake Arrowhead: | 6.7 |
| Adelanto: | 16.2 |
| Phelan: | 32.6 |
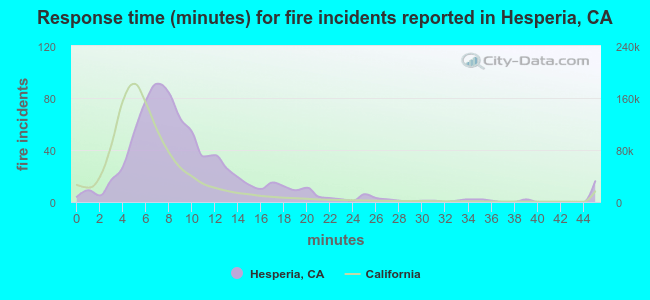 The median response time based on all reported fire incidents is 8 minutes. This is higher than the state median value.
The median response time in Hesperia, CA compared to nearest cities:
(Note: Based on data for all years, including only cities with at least 500 fire incidents)
| Hesperia: | 8 minutes |
| Victorville: | 7 minutes |
| Apple Valley: | 7 minutes |
| San Bernardino: | 7 minutes |
| Rialto: | 8 minutes |
| Fontana: | 7 minutes |
| Colton: | 7 minutes |
| Rancho Cucamonga: | 7 minutes |
| Loma Linda: | 6 minutes |
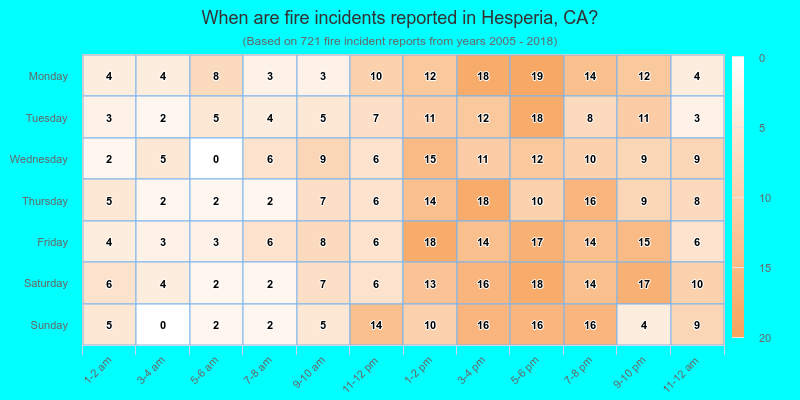
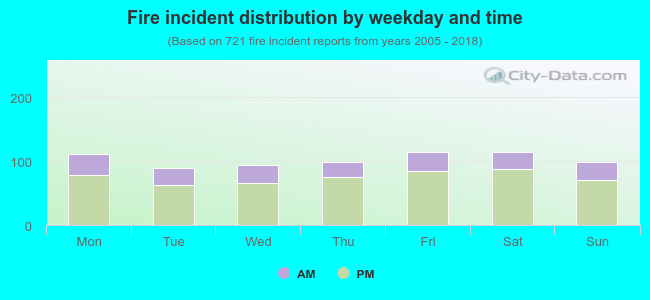 27.0% incidents where reported in the morning and 73.0% in the evening. The most fires (16.0%) took place on Saturday, and the least (12.3%) on Tuesday.
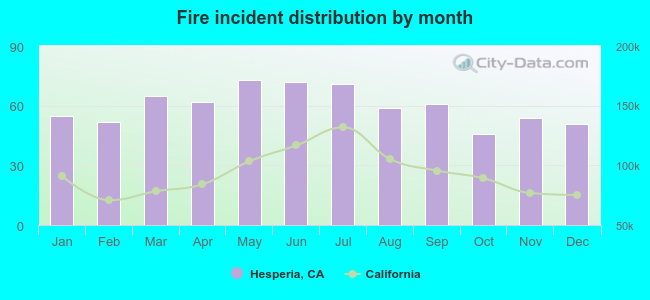 Based on the 721 fires from years 2005 - 2018 most fires (10.1%) took place during May, and the least (6.4%) in October.
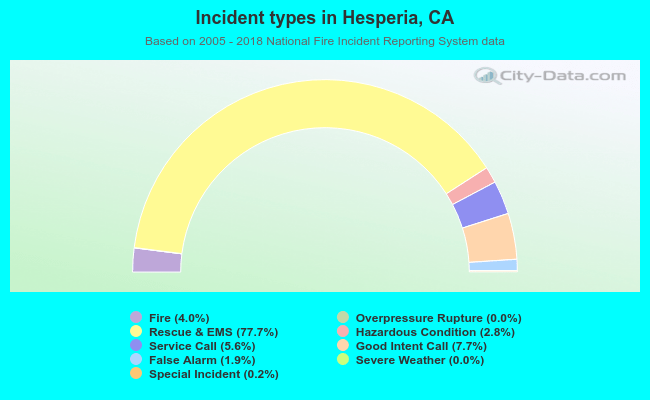 Out of all 17,915 cases reported during the years 2005 - 2018, the most belonged to the categories: Rescue & EMS (77.7%), Good Intent Call (7.7%), and Service Call (5.6%).
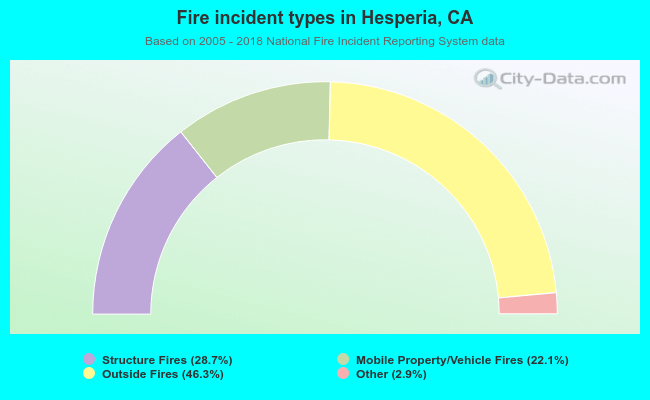 When looking into fire subcategories, the most reports belonged to: Outside Fires (46.3%), and Structure Fires (28.7%).