Lake Los Angeles: Fire Incidents, California (CA)
Where are fire incidents reported in Lake Los Angeles, CA
Something went wrong! Please refresh the page.
|
| |||||||||||||||||||||||||||||||||||||||||||||||||||||||||||||||||||||||||||||||||||||||||||||||||||||||||||||
2005 - 2018 National Fire Incident Reporting System (NFIRS) incidents
- Incident types reported to NFIRS in Lake Los Angeles, CA
- 3,96957.7%Rescue & EMS
- 1,32519.3%Good Intent Call
- 5898.6%Fire
- 5768.4%False Alarm
- 3204.7%Service Call
- 550.8%Hazardous Condition
- 360.5%Special Incident
- Fire incident types reported to NFIRS in Lake Los Angeles, CA
- 38966.0%Outside Fires
- 10417.7%Structure Fires
- 8013.6%Mobile Property/Vehicle Fires
- 162.7%Other
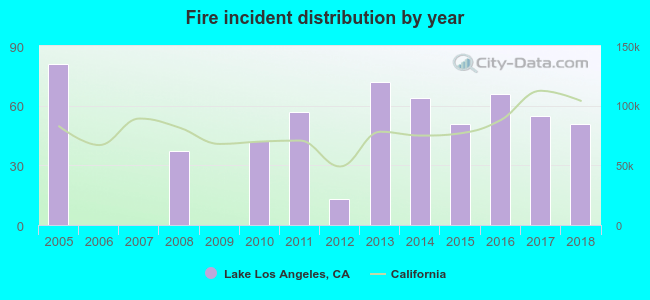 According to the data from the years 2005 - 2018 the average number of fires per year is 42. The highest number of fires - 81 took place in 2005, and the least - 0 in 2006. The data has a dropping trend.
The average number of yearly fire incidents per 10k residents in Lake Los Angeles, CA compared to nearest cities:
(Note: Based on data for the last 3 years, including only cities with population 5,000 and above)
| Lake Los Angeles: | 46.5 |
| Palmdale: | 16.5 |
| Pinon Hills: | 11.0 |
| Lancaster: | 21.1 |
| Phelan: | 32.6 |
| Quartz Hill: | 14.4 |
| Acton: | 64.1 |
| Adelanto: | 16.2 |
| Rosamond: | 40.2 |
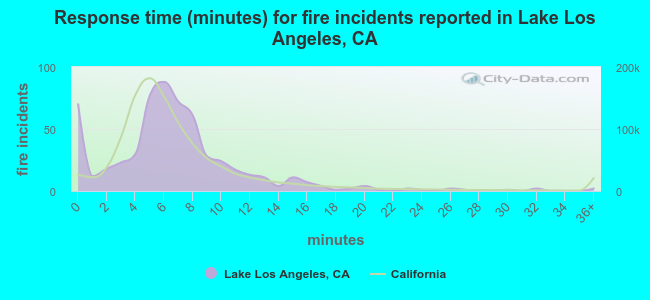 The median response time based on all reported fire incidents is 6 minutes. This is about the same as the state median value.
The median response time in Lake Los Angeles, CA compared to nearest cities:
(Note: Based on data for all years, including only cities with at least 500 fire incidents)
| Lake Los Angeles: | 6 minutes |
| Palmdale: | 5 minutes |
| Lancaster: | 5 minutes |
| Rosamond: | 10 minutes |
| Victorville: | 7 minutes |
| Hesperia: | 8 minutes |
| Glendora: | 5 minutes |
| Azusa: | 5 minutes |
| Monrovia: | 5 minutes |
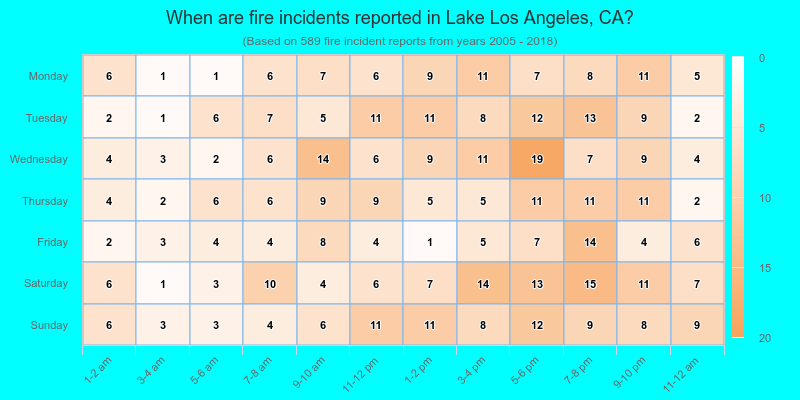
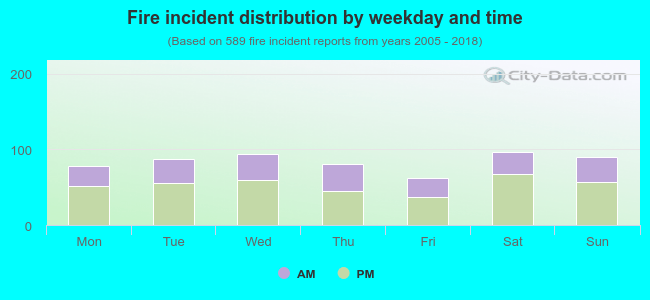 37.0% incidents where reported in the morning and 63.0% in the evening. The most fires (16.5%) took place on Saturday, and the least (10.5%) on Friday.
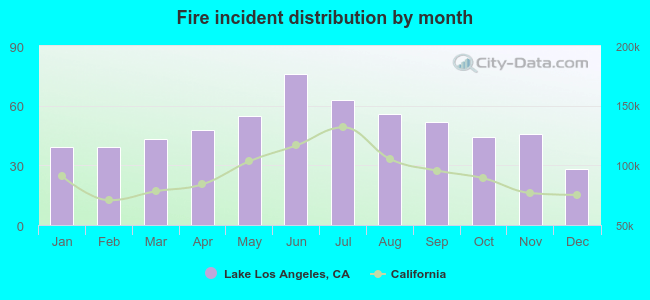 Based on the 589 fire incident reports from years 2005 - 2018 most fires (12.9%) took place during June, and the least (4.8%) in December.
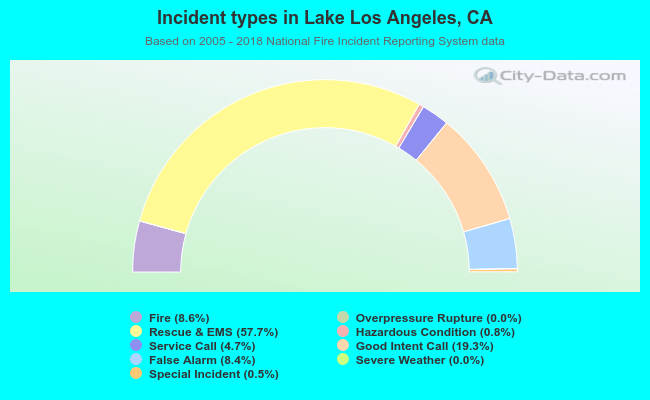 Out of all 6,873 cases reported during the years 2005 - 2018, the most belonged to the categories: Rescue & EMS (57.7%), Good Intent Call (19.3%), and Fire (8.6%).
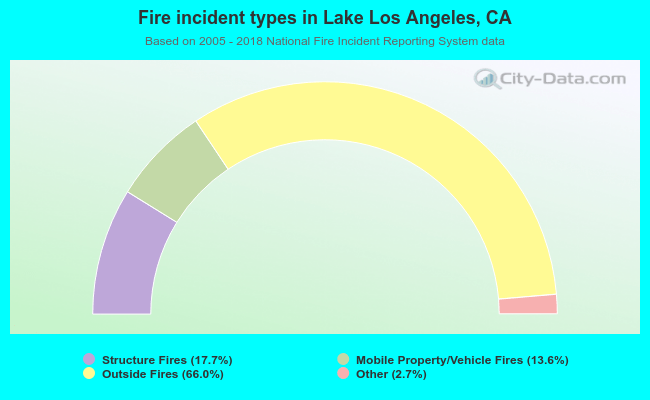 When looking into fire subcategories, the most incidents belonged to: Outside Fires (66.0%), and Structure Fires (17.7%).