Quartz Hill: Fire Incidents, California (CA)
Where are fire incidents reported in Quartz Hill, CA
Something went wrong! Please refresh the page.
|
| |||||||||||||||||||||||||||||||||||||||||||||||||||||||||||||||||||||||||||||||||||||||||||||||||||||||||||||
2005 - 2018 National Fire Incident Reporting System (NFIRS) incidents
- Incident types reported to NFIRS in Quartz Hill, CA
- 4,06269.7%Rescue & EMS
- 1,05018.0%Good Intent Call
- 2173.7%False Alarm
- 2133.7%Service Call
- 1913.3%Fire
- 901.5%Hazardous Condition
- Fire incident types reported to NFIRS in Quartz Hill, CA
- 8343.5%Outside Fires
- 6333.0%Structure Fires
- 3015.7%Mobile Property/Vehicle Fires
- 157.9%Other
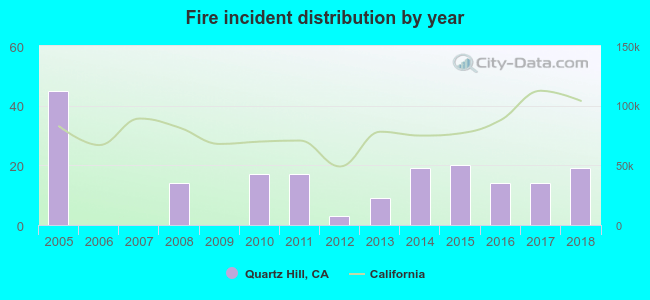 According to the data from the years 2005 - 2018 the average number of fires per year is 14. The highest number of reported fires - 45 took place in 2005, and the least - 0 in 2006. The data has a declining trend.
The average number of yearly fire incidents per 10k residents in Quartz Hill, CA compared to nearest cities:
(Note: Based on data for the last 3 years, including only cities with population 5,000 and above)
| Quartz Hill: | 14.4 |
| Lancaster: | 21.1 |
| Palmdale: | 16.5 |
| Acton: | 64.1 |
| Rosamond: | 40.2 |
| Lake Los Angeles: | 46.5 |
| Santa Clarita: | 12.9 |
| Newhall: | 0.1 |
| Castaic: | 21.7 |

 36.6% incidents where reported in the morning and 63.4% in the evening. The most fires (17.8%) took place on Sunday, and the least (9.4%) on Wednesday.
 According to the 191 fire incidents from years 2005 - 2018 most fires (15.7%) took place during June, and the least (3.7%) in February.
 Out of all 5,830 cases reported during the years 2005 - 2018, the most belonged to the categories: Rescue & EMS (69.7%), Good Intent Call (18.0%), and False Alarm (3.7%).
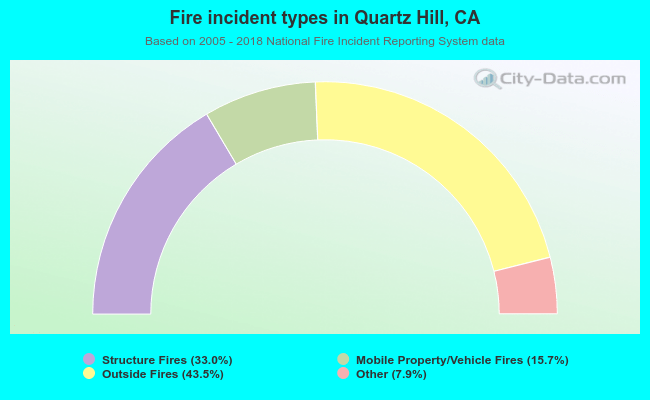 When looking into fire subcategories, the most incidents belonged to: Outside Fires (43.5%), and Structure Fires (33.0%).