Port Charlotte: Fire Incidents, Florida (FL)
Where are fire incidents reported in Port Charlotte, FL
Something went wrong! Please refresh the page.
| Fire incidents reported | |
|---|---|
| Sreet name | Count |
| TAMIAMI TRL | 390 |
| TAMIAMI TR | 386 |
| KINGS HWY | 116 |
| HARBOR BLVD | 80 |
| COCHRAN BLVD | 74 |
| PEACHLAND BLVD | 74 |
| EL JOBEAN RD | 68 |
| LUTHER RD | 62 |
| MURDOCK CIR | 58 |
| I75 | 56 |
| HARBORVIEW RD | 52 |
| KINGS HWY | 52 |
| MIDWAY BLVD | 52 |
| HARBORVIEW RD | 50 |
| MIDWAY BLVD | 46 |
| HARBOR BLVD | 44 |
| EL JOBEAN RD | 40 |
| I-75 | 40 |
| LOVELAND BLVD | 38 |
| SANDHILL BLVD | 38 |
| RAMPART BLVD | 36 |
| COLLINGSWOOD BLVD | 34 |
| EDGEWATER DR | 34 |
| MURDOCK CIR | 34 |
| OLEAN BLVD | 34 |
| TOLEDO BLADE BLVD | 32 |
| VETERANS BLVD | 32 |
| WESTCHESTER BLVD | 32 |
| OLEAN BLVD | 30 |
| SANDHILL BLVD | 30 |
| Other | 3,106 |
2002 - 2018 National Fire Incident Reporting System (NFIRS) incidents
- Incident types reported to NFIRS in Port Charlotte, FL
- 60,03870.8%Rescue & EMS
- 9,16210.8%Service Call
- 5,2506.2%Fire
- 4,6245.5%Good Intent Call
- 3,1353.7%Hazardous Condition
- 2,5153.0%False Alarm
- Fire incident types reported to NFIRS in Port Charlotte, FL
- 3,08558.8%Outside Fires
- 1,08620.7%Structure Fires
- 75414.4%Mobile Property/Vehicle Fires
- 3256.2%Other
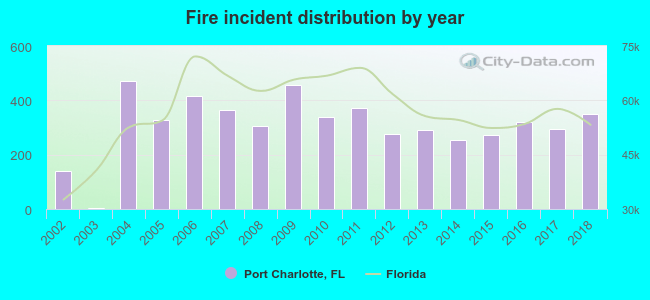 Based on the data from the years 2002 - 2018 the average number of fire incidents per year is 309. The highest number of reported fires - 470 took place in 2004, and the least - 2 in 2003. The data has a rising trend.
The average number of yearly fire incidents per 10k residents in Port Charlotte, FL compared to nearest cities:
(Note: Based on data for the last 3 years, including only cities with population 5,000 and above)
| Port Charlotte: | 59.1 |
| Punta Gorda: | 138.1 |
| North Port: | 36.2 |
| Warm Mineral Springs: | 14.8 |
| Rotonda: | 5.3 |
| Englewood: | 20.0 |
| South Venice: | 1.4 |
| Arcadia: | 344.5 |
| Venice: | 72.4 |
 The median response time based on all reported fire incidents is 6 minutes. This is close to the Florida median value.
The median response time in Port Charlotte, FL compared to nearest cities:
(Note: Based on data for all years, including only cities with at least 500 fire incidents)
| Port Charlotte: | 6 minutes |
| Punta Gorda: | 7 minutes |
| North Port: | 7 minutes |
| Englewood: | 6 minutes |
| Arcadia: | 7 minutes |
| Venice: | 6 minutes |
| Nokomis: | 6 minutes |
| North Fort Myers: | 6 minutes |
| Cape Coral: | 6 minutes |
 According to the data from the years 2002 - 2018 the average number of fire-related fatalities per year is 0. The highest number of reported deaths - 1 took place in 2004, and the lowest - 0 in 2002. The data has a constant trend.
The average number of deaths per 1,000 fire incidents is 1. This indicator was the highest - 3 in 2013, and the lowest 0 in 2002. The trend for deaths per 1,000 fires is constant. Compared to the Florida value the number of deaths per 1,000 fire incidents is much lower.
According to the data from the years 2002 - 2018 the average number of fire-related fatalities per year is 0. The highest number of reported deaths - 1 took place in 2004, and the lowest - 0 in 2002. The data has a constant trend.
The average number of deaths per 1,000 fire incidents is 1. This indicator was the highest - 3 in 2013, and the lowest 0 in 2002. The trend for deaths per 1,000 fires is constant. Compared to the Florida value the number of deaths per 1,000 fire incidents is much lower.Deaths per 1,000 incidents in Port Charlotte, FL compared to nearest cities:
(Note: Based on data for all years, including only cities with at least 2,500 fire incidents)
| Port Charlotte: | 0.8 |
| Punta Gorda: | 2.3 |
| North Port: | 0.6 |
| Arcadia: | 0.9 |
| North Fort Myers: | 1.7 |
| Cape Coral: | 1.2 |
| Fort Myers: | 2.7 |
| Sarasota: | 0.8 |
| Lehigh Acres: | 0.5 |
 According to the data from the years 2002 - 2018 the average number of fire-related yearly casualties is 4. The highest number of casualties - 9 took place in 2014, and the lowest - 0 in 2003. The data has an increasing trend.
The average number of injuries per 1,000 fires is 13. This indicator was the highest - 35 in 2014, and the lowest 0 in 2003. The trend for injuries per 1,000 fire incidents is rising. Compared to the state value the number of injuries per 1,000 fire incidents is about the same.
According to the data from the years 2002 - 2018 the average number of fire-related yearly casualties is 4. The highest number of casualties - 9 took place in 2014, and the lowest - 0 in 2003. The data has an increasing trend.
The average number of injuries per 1,000 fires is 13. This indicator was the highest - 35 in 2014, and the lowest 0 in 2003. The trend for injuries per 1,000 fire incidents is rising. Compared to the state value the number of injuries per 1,000 fire incidents is about the same.Casualties per 1,000 incidents in Port Charlotte, FL compared to nearest cities:
(Note: Based on data for all years, including only cities with at least 500 fire incidents)
| Port Charlotte: | 13.3 |
| Punta Gorda: | 5.3 |
| North Port: | 4.3 |
| Englewood: | 2.0 |
| Arcadia: | 3.1 |
| Venice: | 4.0 |
| Nokomis: | 3.6 |
| North Fort Myers: | 7.1 |
| Cape Coral: | 13.1 |
 25.3% incidents where reported in the morning and 74.7% in the evening. The most fires (15.4%) took place on Sunday, and the least (13.2%) on Thursday.
 Based on the 5,250 fires from years 2002 - 2018 most fires (11.4%) took place during May, and the least (5.3%) in September.
 Out of all 84,818 cases reported during the years 2002 - 2018, the most belonged to the categories: Rescue & EMS (70.8%), Service Call (10.8%), and Fire (6.2%).
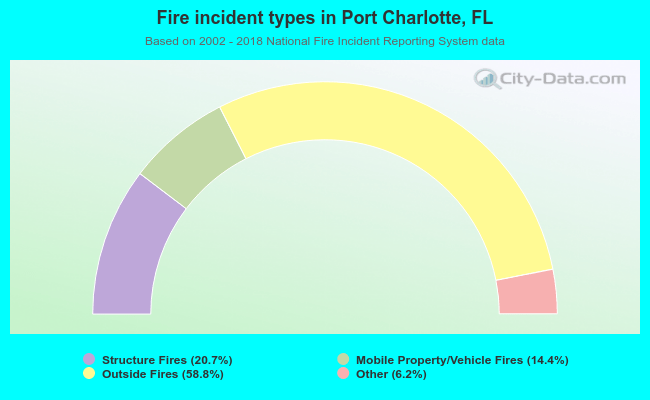 When looking into fire subcategories, the most incidents belonged to: Outside Fires (58.8%), and Structure Fires (20.7%).