Fort Myers: Fire Incidents, Florida (FL)
Where are fire incidents reported in Fort Myers, FL
Something went wrong! Please refresh the page.
| Fire incidents reported | |
|---|---|
| Sreet name | Count |
| CLEVELAND AVE | 712 |
| COLONIAL BLVD | 558 |
| TAMIAMI TRL | 312 |
| PALM BEACH BLVD | 288 |
| ALICO RD | 276 |
| CENTRAL AVE | 260 |
| DANIELS PKY | 214 |
| WINKLER AVE | 202 |
| FOWLER ST | 174 |
| METRO | 162 |
| MCGREGOR BLVD | 158 |
| METRO PKY | 148 |
| EVANS AVE | 134 |
| FIRST ST | 134 |
| MICHIGAN AVE | 134 |
| EDISON AVE | 128 |
| SUMMERLIN RD | 126 |
| BROADWAY | 120 |
| SAN CARLOS BLVD | 110 |
| I-75 | 102 |
| GLADIOLUS DR | 100 |
| DR MARTIN LUTHER KING JR BLVD | 96 |
| MCGREGOR BLVD. | 92 |
| THOMAS RD | 90 |
| VERONICA S SHOEMAKER BLVD | 90 |
| CYPRESS DR | 88 |
| DR M L KING JR BLVD | 86 |
| SIX MILE CYPRESS PKY | 86 |
| AIRPORT HAUL RD | 80 |
| ORTIZ AVE | 78 |
| Other | 6,369 |
2002 - 2018 National Fire Incident Reporting System (NFIRS) incidents
- Incident types reported to NFIRS in Fort Myers, FL
- 128,47458.4%Rescue & EMS
- 39,56918.0%Good Intent Call
- 14,2116.5%False Alarm
- 14,0706.4%Hazardous Condition
- 11,7075.3%Fire
- 11,5155.2%Service Call
- Fire incident types reported to NFIRS in Fort Myers, FL
- 5,81549.7%Outside Fires
- 3,24527.7%Structure Fires
- 2,26319.3%Mobile Property/Vehicle Fires
- 3843.3%Other
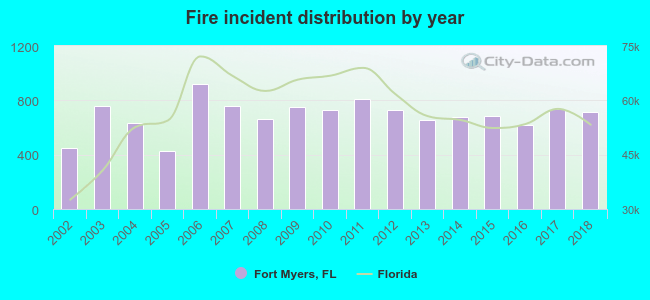 Based on the data from the years 2002 - 2018 the average number of fire incidents per year is 689. The highest number of reported fire incidents - 923 took place in 2006, and the least - 425 in 2005. The data has a rising trend.
The average number of yearly fire incidents per 10k residents in Fort Myers, FL compared to nearest cities:
(Note: Based on data for the last 3 years, including only cities with population 5,000 and above)
| Fort Myers: | 97.1 |
| North Fort Myers: | 59.6 |
| Gateway: | 1.2 |
| Cape Coral: | 14.4 |
| San Carlos Park: | 0.6 |
| Lehigh Acres: | 39.2 |
| Fort Myers Beach: | 6.9 |
| Estero: | 26.8 |
| Sanibel: | 40.4 |
 The median response time based on all reported fire incidents is 5 minutes. This is lower compared to the state median value.
The median response time in Fort Myers, FL compared to nearest cities:
(Note: Based on data for all years, including only cities with at least 500 fire incidents)
| Fort Myers: | 5 minutes |
| North Fort Myers: | 6 minutes |
| Cape Coral: | 6 minutes |
| Lehigh Acres: | 7 minutes |
| Estero: | 6 minutes |
| Alva: | 7 minutes |
| Bonita Springs: | 6 minutes |
| Punta Gorda: | 7 minutes |
| La Belle: | 7 minutes |
 According to the data from the years 2002 - 2018 the average number of fire-related yearly deaths is 2. The highest number of reported deaths - 4 took place in 2005, and the lowest - 0 in 2007. The data has a constant trend.
The average number of fatalities per 1,000 fires is 3. This indicator was the highest - 9 in 2005, and the lowest 0 in 2007. The trend for fatalities per 1,000 fire incidents is declining. Compared to the Florida value the number of deaths per 1,000 fire incidents is higher.
According to the data from the years 2002 - 2018 the average number of fire-related yearly deaths is 2. The highest number of reported deaths - 4 took place in 2005, and the lowest - 0 in 2007. The data has a constant trend.
The average number of fatalities per 1,000 fires is 3. This indicator was the highest - 9 in 2005, and the lowest 0 in 2007. The trend for fatalities per 1,000 fire incidents is declining. Compared to the Florida value the number of deaths per 1,000 fire incidents is higher.Deaths per 1,000 incidents in Fort Myers, FL compared to nearest cities:
(Note: Based on data for all years, including only cities with at least 2,500 fire incidents)
| Fort Myers: | 2.7 |
| North Fort Myers: | 1.7 |
| Cape Coral: | 1.2 |
| Lehigh Acres: | 0.5 |
| Punta Gorda: | 2.3 |
| Port Charlotte: | 0.8 |
| Naples: | 1.1 |
| North Port: | 0.6 |
| Arcadia: | 0.9 |
 Based on the reports from the years 2002 - 2018 the average number of fire-related casualties per year is 11. The highest number of injuries - 19 took place in 2006, and the lowest - 4 in 2014. The data has a growing trend.
The average number of injuries per 1,000 fire incidents is 15. This indicator was the highest - 23 in 2010, and the lowest 6 in 2014. The trend for injuries per 1,000 fires is growing. Compared to the state value the number of casualties per 1,000 fires is higher.
Based on the reports from the years 2002 - 2018 the average number of fire-related casualties per year is 11. The highest number of injuries - 19 took place in 2006, and the lowest - 4 in 2014. The data has a growing trend.
The average number of injuries per 1,000 fire incidents is 15. This indicator was the highest - 23 in 2010, and the lowest 6 in 2014. The trend for injuries per 1,000 fires is growing. Compared to the state value the number of casualties per 1,000 fires is higher.Casualties per 1,000 incidents in Fort Myers, FL compared to nearest cities:
(Note: Based on data for all years, including only cities with at least 500 fire incidents)
| Fort Myers: | 15.4 |
| North Fort Myers: | 7.1 |
| Cape Coral: | 13.1 |
| Lehigh Acres: | 10.9 |
| Estero: | 3.8 |
| Alva: | 7.9 |
| Bonita Springs: | 5.2 |
| Punta Gorda: | 5.3 |
| La Belle: | 3.9 |
 29.5% incidents where reported in the morning and 70.5% in the evening. The most fires (15.4%) took place on Friday, and the least (13.4%) on Wednesday.
 According to the 11,707 reports from years 2002 - 2018 most fires (11.8%) took place during May, and the least (5.5%) in September.
 Out of all 219,901 cases reported during the years 2002 - 2018, the most belonged to the categories: Rescue & EMS (58.4%), Good Intent Call (18.0%), and False Alarm (6.5%).
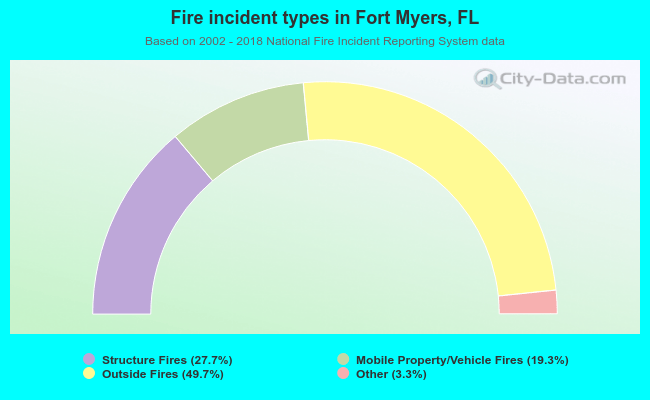 When looking into fire subcategories, the most incidents belonged to: Outside Fires (49.7%), and Structure Fires (27.7%).