North Fort Myers: Fire Incidents, Florida (FL)
Where are fire incidents reported in North Fort Myers, FL
Something went wrong! Please refresh the page.
| Fire incidents reported | |
|---|---|
| Sreet name | Count |
| TAMIAMI TRL | 288 |
| CLEVELAND AVE | 264 |
| BAYSHORE RD | 248 |
| INTERSTATE 75 | 182 |
| PINE ISLAND RD | 116 |
| EBSON DR | 104 |
| BREEZE DR | 92 |
| MARX DR | 88 |
| PONDELLA RD | 82 |
| SLATER RD | 74 |
| GRADY DR | 64 |
| HART DR | 60 |
| LAUREL DR | 54 |
| BOGART DR | 50 |
| NALLE GRADE RD | 50 |
| NALLE RD | 50 |
| STATE ROAD 31 | 50 |
| BARBIE LA | 44 |
| MCDANIEL DR | 44 |
| SUNCOAST DR | 44 |
| BARBIE LN | 42 |
| ORANGE GROVE BLVD | 42 |
| DURRANCE RD | 40 |
| HECK DR | 40 |
| BARTHOLOMEW DR | 38 |
| ELAND DR | 36 |
| GARDEN ST | 36 |
| HANCOCK BRIDGE PKY | 36 |
| LITTLETON RD | 36 |
| DEAL RD | 34 |
| Other | 1,116 |
2003 - 2018 National Fire Incident Reporting System (NFIRS) incidents
- Incident types reported to NFIRS in North Fort Myers, FL
- 31,71662.4%Rescue & EMS
- 7,92415.6%Good Intent Call
- 3,7037.3%Service Call
- 3,5447.0%Fire
- 2,2534.4%Hazardous Condition
- 1,6153.2%False Alarm
- Fire incident types reported to NFIRS in North Fort Myers, FL
- 2,17461.3%Outside Fires
- 74020.9%Structure Fires
- 51014.4%Mobile Property/Vehicle Fires
- 1203.4%Other
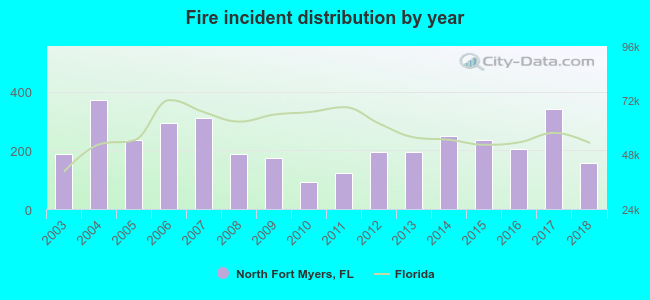 Based on the data from the years 2003 - 2018 the average number of fires per year is 222. The highest number of fires - 370 took place in 2004, and the least - 92 in 2010. The data has a dropping trend.
The average number of yearly fire incidents per 10k residents in North Fort Myers, FL compared to nearest cities:
(Note: Based on data for the last 3 years, including only cities with population 5,000 and above)
| North Fort Myers: | 59.6 |
| Fort Myers: | 97.1 |
| Cape Coral: | 14.4 |
| Gateway: | 1.2 |
| San Carlos Park: | 0.6 |
| Lehigh Acres: | 39.2 |
| Punta Gorda: | 138.1 |
| Fort Myers Beach: | 6.9 |
| Estero: | 26.8 |
 The median response time based on all reported fire incidents is 6 minutes. This is about the same as the Florida median value.
The median response time in North Fort Myers, FL compared to nearest cities:
(Note: Based on data for all years, including only cities with at least 500 fire incidents)
| North Fort Myers: | 6 minutes |
| Fort Myers: | 5 minutes |
| Cape Coral: | 6 minutes |
| Alva: | 7 minutes |
| Lehigh Acres: | 7 minutes |
| Punta Gorda: | 7 minutes |
| Estero: | 6 minutes |
| Port Charlotte: | 6 minutes |
| Bonita Springs: | 6 minutes |
 According to the reports from the years 2003 - 2018 the average number of fire-related yearly deaths is 0. The highest number of deaths - 2 took place in 2012, and the lowest - 0 in 2003. The data has a constant trend.
The average number of deaths per 1,000 fire incidents is 2. This indicator was the highest - 10 in 2012, and the lowest 0 in 2003. The trend for fatalities per 1,000 incidents is constant. Compared to the Florida value the number of deaths per 1,000 fires is similar.
According to the reports from the years 2003 - 2018 the average number of fire-related yearly deaths is 0. The highest number of deaths - 2 took place in 2012, and the lowest - 0 in 2003. The data has a constant trend.
The average number of deaths per 1,000 fire incidents is 2. This indicator was the highest - 10 in 2012, and the lowest 0 in 2003. The trend for fatalities per 1,000 incidents is constant. Compared to the Florida value the number of deaths per 1,000 fires is similar.Deaths per 1,000 incidents in North Fort Myers, FL compared to nearest cities:
(Note: Based on data for all years, including only cities with at least 2,500 fire incidents)
| North Fort Myers: | 1.7 |
| Fort Myers: | 2.7 |
| Cape Coral: | 1.2 |
| Lehigh Acres: | 0.5 |
| Punta Gorda: | 2.3 |
| Port Charlotte: | 0.8 |
| North Port: | 0.6 |
| Arcadia: | 0.9 |
| Naples: | 1.1 |
 Based on the reports from the years 2003 - 2018 the average number of fire-related casualties per year is 2. The highest number of reported injuries - 3 took place in 2005, and the lowest - 0 in 2010. The data has a decreasing trend.
The average number of injuries per 1,000 fires is 7. This indicator was the highest - 17 in 2009, and the lowest 0 in 2010. The trend for injuries per 1,000 fires is dropping. Compared to the Florida value the number of injuries per 1,000 fires is lower.
Based on the reports from the years 2003 - 2018 the average number of fire-related casualties per year is 2. The highest number of reported injuries - 3 took place in 2005, and the lowest - 0 in 2010. The data has a decreasing trend.
The average number of injuries per 1,000 fires is 7. This indicator was the highest - 17 in 2009, and the lowest 0 in 2010. The trend for injuries per 1,000 fires is dropping. Compared to the Florida value the number of injuries per 1,000 fires is lower.Casualties per 1,000 incidents in North Fort Myers, FL compared to nearest cities:
(Note: Based on data for all years, including only cities with at least 500 fire incidents)
| North Fort Myers: | 7.1 |
| Fort Myers: | 15.4 |
| Cape Coral: | 13.1 |
| Alva: | 7.9 |
| Lehigh Acres: | 10.9 |
| Punta Gorda: | 5.3 |
| Estero: | 3.8 |
| Port Charlotte: | 13.3 |
| Bonita Springs: | 5.2 |
 26.6% incidents where reported in the morning and 73.4% in the evening. The most fires (16.1%) took place on Saturday, and the least (13.3%) on Tuesday.
 Based on the 3,544 fire incidents from years 2003 - 2018 most fires (13.4%) took place during May, and the least (4.7%) in September.
 Out of all 50,861 cases reported during the years 2003 - 2018, the most belonged to the categories: Rescue & EMS (62.4%), Good Intent Call (15.6%), and Service Call (7.3%).
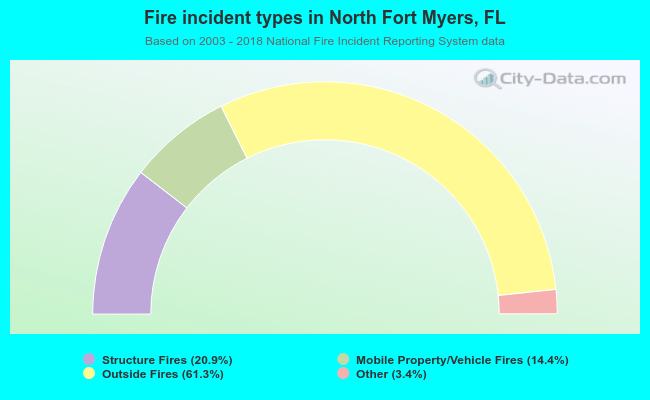 When looking into fire subcategories, the most reports belonged to: Outside Fires (61.3%), and Structure Fires (20.9%).