North Port: Fire Incidents, Florida (FL)
Where are fire incidents reported in North Port, FL
Something went wrong! Please refresh the page.
| Fire incidents reported | |
|---|---|
| Sreet name | Count |
| I75 | 564 |
| TAMIAMI TRL | 214 |
| PRICE BLVD | 144 |
| BISCAYNE DR | 136 |
| YORKSHIRE ST | 116 |
| TOLEDO BLADE BLVD | 110 |
| SUMTER BLVD | 92 |
| CRANBERRY BLVD | 72 |
| CHAMBERLAIN BLVD | 64 |
| SALFORD BLVD | 62 |
| PANACEA BLVD | 46 |
| TROPICAIRE BLVD | 46 |
| PAN AMERICAN BLVD | 44 |
| LANGLAIS DR | 34 |
| RIVER RD | 32 |
| ESTATES DR | 30 |
| GREENWOOD AVE | 30 |
| JEANNIN DR | 30 |
| ATWATER DR | 28 |
| RAINTREE BLVD | 28 |
| SAN MATEO DR | 28 |
| HILLSBOROUGH BLVD | 26 |
| JOEWOOD CIR | 26 |
| SHRIMP LN | 26 |
| WENONA DR | 22 |
| PANDORA TER | 20 |
| JOEJEFF ST | 18 |
| KENVIL DR | 18 |
| RIDGEWOOD DR | 18 |
| TALON BAY DR | 18 |
| Other | 1,378 |
2004 - 2018 National Fire Incident Reporting System (NFIRS) incidents
- Incident types reported to NFIRS in North Port, FL
- 19,82263.6%Rescue & EMS
- 3,52011.3%Fire
- 3,16710.2%Service Call
- 1,9246.2%Good Intent Call
- 1,3804.4%False Alarm
- 1,3284.3%Hazardous Condition
- Fire incident types reported to NFIRS in North Port, FL
- 2,49370.8%Outside Fires
- 47213.4%Structure Fires
- 37810.7%Mobile Property/Vehicle Fires
- 1775.0%Other
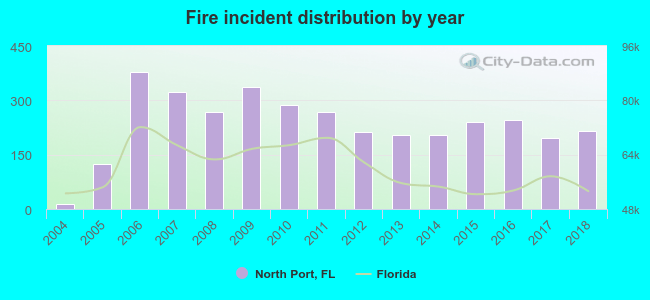 According to the data from the years 2004 - 2018 the average number of fire incidents per year is 234. The highest number of reported fires - 377 took place in 2006, and the least - 14 in 2004. The data has an increasing trend.
The average number of yearly fire incidents per 10k residents in North Port, FL compared to nearest cities:
(Note: Based on data for the last 3 years, including only cities with population 5,000 and above)
| North Port: | 36.2 |
| Warm Mineral Springs: | 14.8 |
| Port Charlotte: | 59.1 |
| Punta Gorda: | 138.1 |
| Englewood: | 20.0 |
| Rotonda: | 5.3 |
| South Venice: | 1.4 |
| Venice: | 72.4 |
| Osprey: | 8.2 |
 The median response time based on all reported fire incidents is 7 minutes. This is comparable to the Florida median value.
The median response time in North Port, FL compared to nearest cities:
(Note: Based on data for all years, including only cities with at least 500 fire incidents)
| North Port: | 7 minutes |
| Port Charlotte: | 6 minutes |
| Punta Gorda: | 7 minutes |
| Englewood: | 6 minutes |
| Venice: | 6 minutes |
| Nokomis: | 6 minutes |
| Arcadia: | 7 minutes |
| Sarasota: | 6 minutes |
| North Fort Myers: | 6 minutes |
 Based on the data from the years 2004 - 2018 the average number of fire-related yearly casualties is 1. The highest number of reported casualties - 3 took place in 2014, and the lowest - 0 in 2004. The data has a growing trend.
The average number of casualties per 1,000 fires is 4. This indicator was the highest - 15 in 2014, and the lowest 0 in 2004. The trend for injuries per 1,000 fires is growing. Compared to the Florida value the number of casualties per 1,000 fires is much lower.
Based on the data from the years 2004 - 2018 the average number of fire-related yearly casualties is 1. The highest number of reported casualties - 3 took place in 2014, and the lowest - 0 in 2004. The data has a growing trend.
The average number of casualties per 1,000 fires is 4. This indicator was the highest - 15 in 2014, and the lowest 0 in 2004. The trend for injuries per 1,000 fires is growing. Compared to the Florida value the number of casualties per 1,000 fires is much lower.Casualties per 1,000 incidents in North Port, FL compared to nearest cities:
(Note: Based on data for all years, including only cities with at least 500 fire incidents)
| North Port: | 4.3 |
| Port Charlotte: | 13.3 |
| Punta Gorda: | 5.3 |
| Englewood: | 2.0 |
| Venice: | 4.0 |
| Nokomis: | 3.6 |
| Arcadia: | 3.1 |
| Sarasota: | 6.5 |
| North Fort Myers: | 7.1 |
 22.4% incidents where reported in the morning and 77.6% in the evening. The most fires (17.1%) took place on Sunday, and the least (12.8%) on Wednesday.
 According to the 3,520 reports from years 2004 - 2018 most fires (13.2%) took place during May, and the least (5.0%) in September.
 Out of all 31,175 cases reported during the years 2004 - 2018, the most belonged to the categories: Rescue & EMS (63.6%), Fire (11.3%), and Service Call (10.2%).
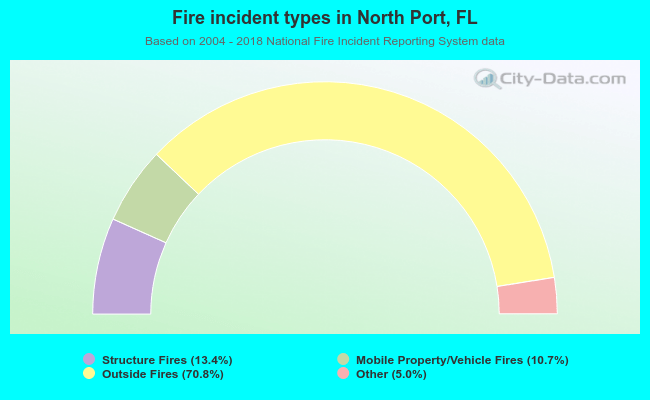 When looking into fire subcategories, the most incidents belonged to: Outside Fires (70.8%), and Structure Fires (13.4%).