Englewood: Fire Incidents, Florida (FL)
Where are fire incidents reported in Englewood, FL
Something went wrong! Please refresh the page.
| Fire incidents reported | |
|---|---|
| Sreet name | Count |
| PLACIDA RD | 164 |
| MCCALL RD | 140 |
| MANASOTA KEY RD | 84 |
| RIVER RD | 84 |
| BEACH RD | 82 |
| INDIANA AVE | 72 |
| SAN CASA DR | 58 |
| ENGLEWOOD RD | 56 |
| MANASOTA BEACH RD | 48 |
| GULF BLVD | 40 |
| DEARBORN ST | 38 |
| ACCESS RD | 32 |
| KEYWAY RD | 30 |
| MC CALL RD | 30 |
| SHADOW LN | 30 |
| BOUNDARY BLVD | 28 |
| LANGSNER ST | 28 |
| BAYSHORE DR | 26 |
| PINE ST | 26 |
| CRESTWOOD RD | 22 |
| GULFSTREAM BLVD | 22 |
| OLD ENGLEWOOD RD | 22 |
| PENDLETON AVE | 22 |
| OXFORD DR | 20 |
| STONER RD | 20 |
| WENTWORTH ST | 20 |
| WINCHESTER BLVD | 20 |
| STRATFORD RD | 18 |
| GASPARILLA PINES BLVD | 16 |
| ROTONDA BLVD | 16 |
| Other | 720 |
2002 - 2018 National Fire Incident Reporting System (NFIRS) incidents
- Incident types reported to NFIRS in Englewood, FL
- 18,34665.2%Rescue & EMS
- 2,96810.6%Service Call
- 2,5349.0%Hazardous Condition
- 2,0347.2%Fire
- 1,6055.7%Good Intent Call
- 5932.1%False Alarm
- Fire incident types reported to NFIRS in Englewood, FL
- 1,28062.9%Outside Fires
- 45422.3%Structure Fires
- 1879.2%Mobile Property/Vehicle Fires
- 1135.6%Other
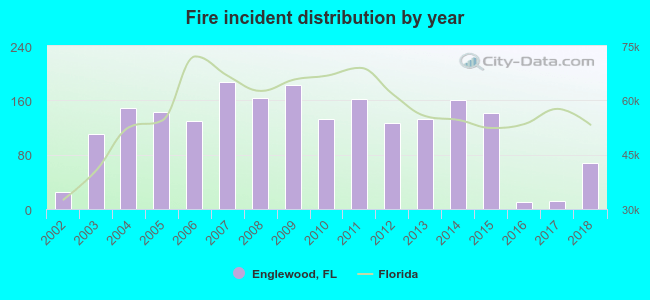 According to the data from the years 2002 - 2018 the average number of fire incidents per year is 120. The highest number of reported fires - 187 took place in 2007, and the least - 10 in 2016. The data has a growing trend.
The average number of yearly fire incidents per 10k residents in Englewood, FL compared to nearest cities:
(Note: Based on data for the last 3 years, including only cities with population 5,000 and above)
| Englewood: | 20.0 |
| South Venice: | 1.4 |
| Rotonda: | 5.3 |
| Warm Mineral Springs: | 14.8 |
| Venice: | 72.4 |
| North Port: | 36.2 |
| Port Charlotte: | 59.1 |
| Osprey: | 8.2 |
| Punta Gorda: | 138.1 |
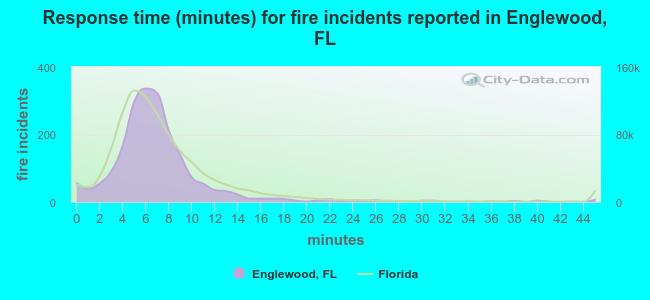 The median response time based on all reported fire incidents is 6 minutes. This is similar to the state median value.
The median response time in Englewood, FL compared to nearest cities:
(Note: Based on data for all years, including only cities with at least 500 fire incidents)
| Englewood: | 6 minutes |
| Venice: | 6 minutes |
| Nokomis: | 6 minutes |
| North Port: | 7 minutes |
| Port Charlotte: | 6 minutes |
| Punta Gorda: | 7 minutes |
| Sarasota: | 6 minutes |
| Cape Coral: | 6 minutes |
| North Fort Myers: | 6 minutes |
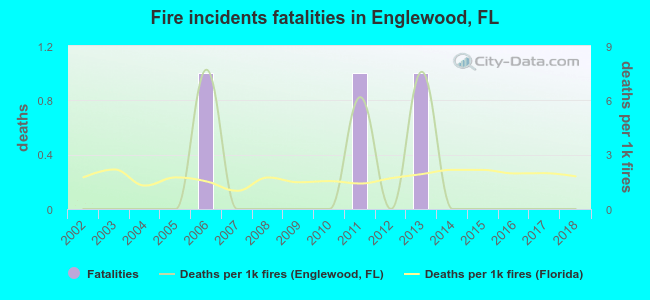 According to the reports from the years 2002 - 2018 the average number of fire-related fatalities per year is 0. The highest number of reported deaths - 1 took place in 2006, and the lowest - 0 in 2002. The data has a constant trend.
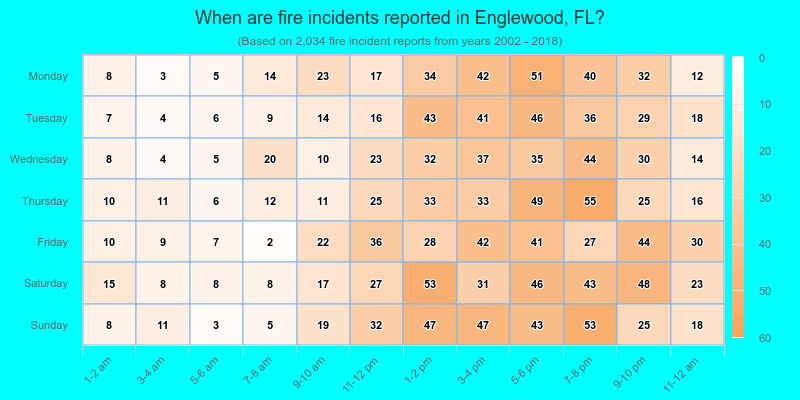
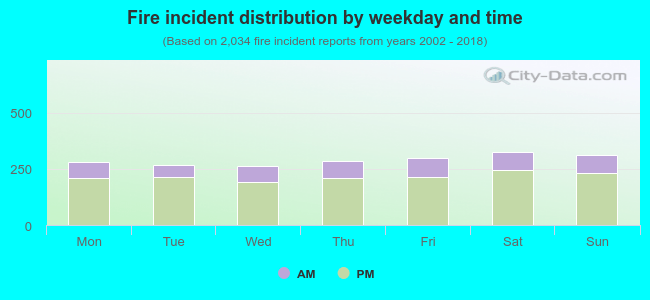 25.5% incidents where reported in the morning and 74.5% in the evening. The most fires (16.1%) took place on Saturday, and the least (12.9%) on Wednesday.
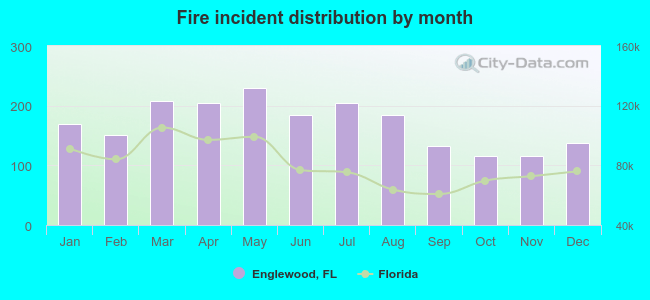 Based on the 2,034 incident reports from years 2002 - 2018 most fires (11.3%) took place during May, and the least (5.7%) in October.
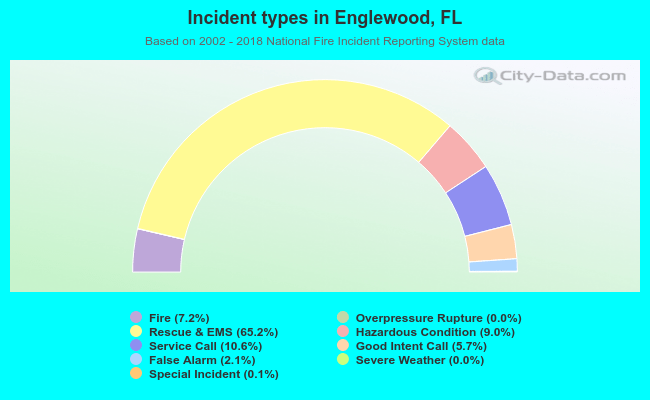 Out of all 28,121 cases reported during the years 2002 - 2018, the most belonged to the categories: Rescue & EMS (65.2%), Service Call (10.6%), and Hazardous Condition (9.0%).
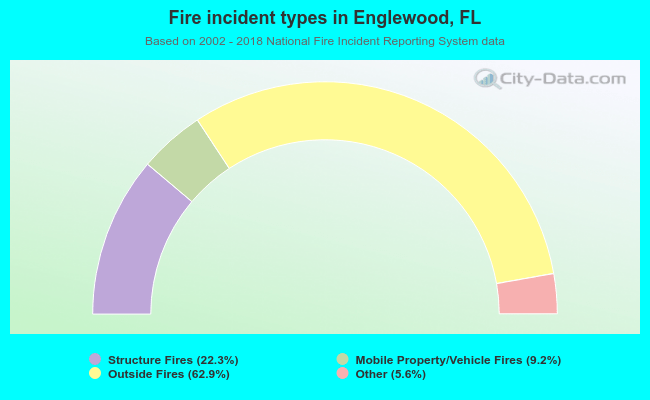 When looking into fire subcategories, the most incidents belonged to: Outside Fires (62.9%), and Structure Fires (22.3%).