Rotonda: Fire Incidents, Florida (FL)
Where are fire incidents reported in Rotonda, FL
Something went wrong! Please refresh the page.
|
| |||||||||||||||||||||||||||||||||||||||||||||||||||||||||||||||||||||||||||||||||||||||||||||||||||||||||||||
2003 - 2018 National Fire Incident Reporting System (NFIRS) incidents
- Incident types reported to NFIRS in Rotonda, FL
- 1,74471.7%Rescue & EMS
- 24410.0%Service Call
- 1546.3%Fire
- 1536.3%Good Intent Call
- 994.1%Hazardous Condition
- 321.3%False Alarm
- 30.1%Special Incident
- Fire incident types reported to NFIRS in Rotonda, FL
- 8857.1%Outside Fires
- 4227.3%Structure Fires
- 1711.0%Mobile Property/Vehicle Fires
- 74.5%Other
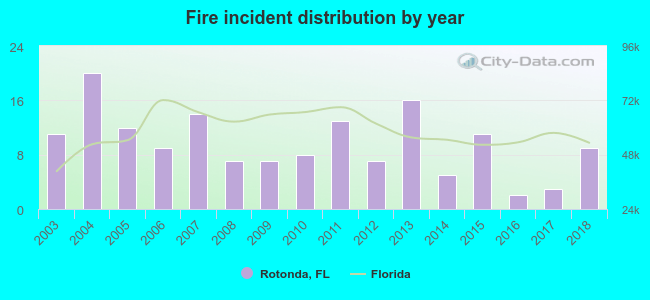 According to the data from the years 2003 - 2018 the average number of fire incidents per year is 10. The highest number of reported fire incidents - 20 took place in 2004, and the least - 2 in 2016. The data has a decreasing trend.
The average number of yearly fire incidents per 10k residents in Rotonda, FL compared to nearest cities:
(Note: Based on data for the last 3 years, including only cities with population 5,000 and above)
| Rotonda: | 5.3 |
| Englewood: | 20.0 |
| Warm Mineral Springs: | 14.8 |
| Port Charlotte: | 59.1 |
| North Port: | 36.2 |
| Punta Gorda: | 138.1 |
| South Venice: | 1.4 |
| Venice: | 72.4 |
| Cape Coral: | 14.4 |

 24.7% incidents where reported in the morning and 75.3% in the evening. The most fires (18.2%) took place on Wednesday, and the least (11.0%) on Thursday.
 According to the 154 incident reports from years 2003 - 2018 most fires (13.0%) took place during June, and the least (3.9%) in December.
 Out of all 2,431 cases reported during the years 2003 - 2018, the most belonged to the categories: Overpressure Rupture (71.7%), Hazardous Condition (10.0%), and Fire (6.3%).
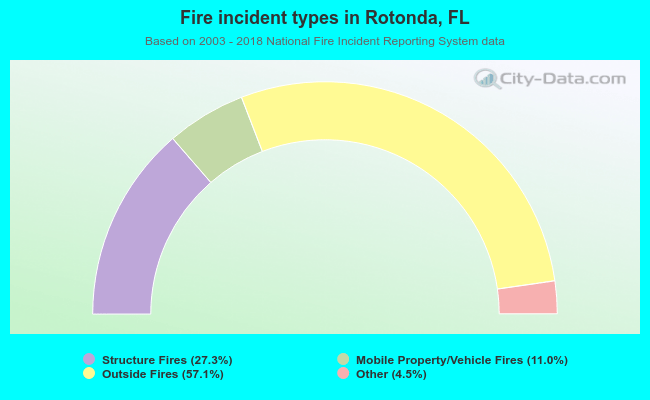 When looking into fire subcategories, the most reports belonged to: Outside Fires (57.1%), and Structure Fires (27.3%).