Minneola: Fire Incidents, Florida (FL)
Where are fire incidents reported in Minneola, FL
Something went wrong! Please refresh the page.
|
| |||||||||||||||||||||||||||||||||||||||||||||||||||||||||||||||||||||||||||||||||||||||||||||||||||||||||||||
2002 - 2018 National Fire Incident Reporting System (NFIRS) incidents
- Incident types reported to NFIRS in Minneola, FL
- 4,00158.5%Rescue & EMS
- 95714.0%Good Intent Call
- 83512.2%Fire
- 4035.9%Hazardous Condition
- 3505.1%Service Call
- 2313.4%False Alarm
- 550.8%Special Incident
- 70.1%Severe Weather
- Fire incident types reported to NFIRS in Minneola, FL
- 38345.9%Outside Fires
- 25830.9%Structure Fires
- 14517.4%Mobile Property/Vehicle Fires
- 495.9%Other
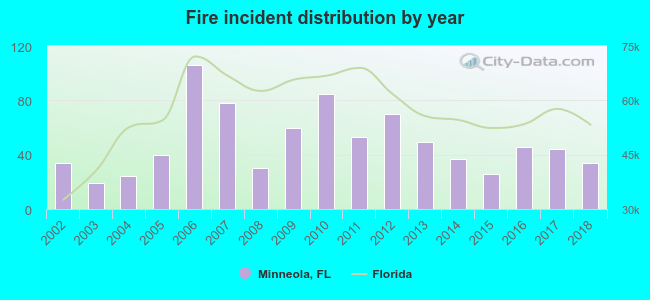 According to the data from the years 2002 - 2018 the average number of fire incidents per year is 49. The highest number of fire incidents - 106 took place in 2006, and the least - 19 in 2003. The data has a constant trend.
The average number of yearly fire incidents per 10k residents in Minneola, FL compared to nearest cities:
(Note: Based on data for the last 3 years, including only cities with population 5,000 and above)
| Minneola: | 39.9 |
| Clermont: | 66.8 |
| Groveland: | 139.3 |
| Mascotte: | 58.0 |
| Winter Garden: | 38.1 |
| Ocoee: | 36.9 |
| Tavares: | 64.1 |
| Apopka: | 42.1 |
| Mount Dora: | 58.9 |
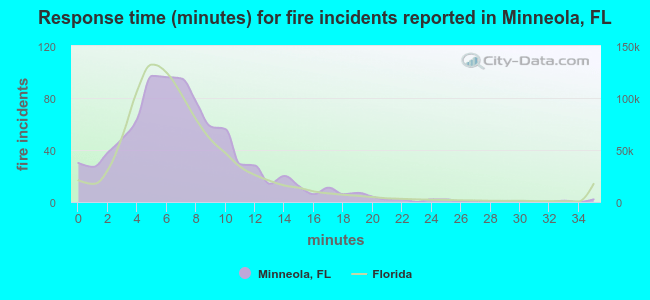 The median response time based on all reported fire incidents is 7 minutes. This is close to the state median value.
The median response time in Minneola, FL compared to nearest cities:
(Note: Based on data for all years, including only cities with at least 500 fire incidents)
| Minneola: | 7 minutes |
| Clermont: | 7 minutes |
| Groveland: | 8 minutes |
| Winter Garden: | 6 minutes |
| Ocoee: | 6 minutes |
| Tavares: | 6 minutes |
| Apopka: | 5 minutes |
| Mount Dora: | 6 minutes |
| Leesburg: | 7 minutes |
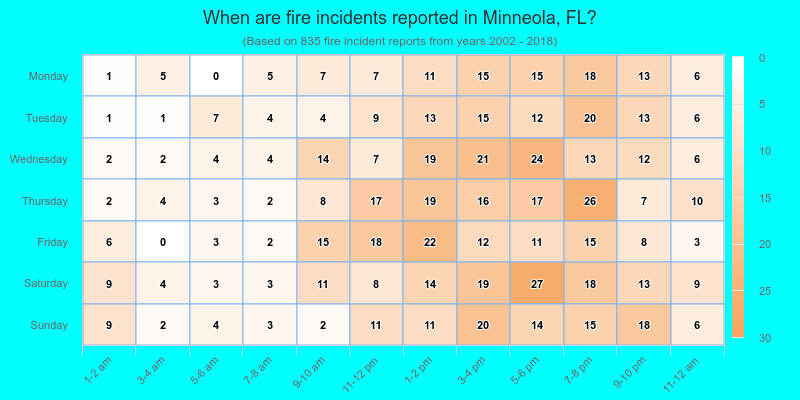
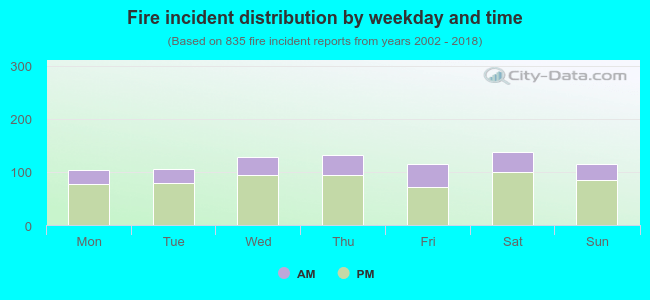 27.9% incidents where reported in the morning and 72.1% in the evening. The most fires (16.5%) took place on Saturday, and the least (12.3%) on Monday.
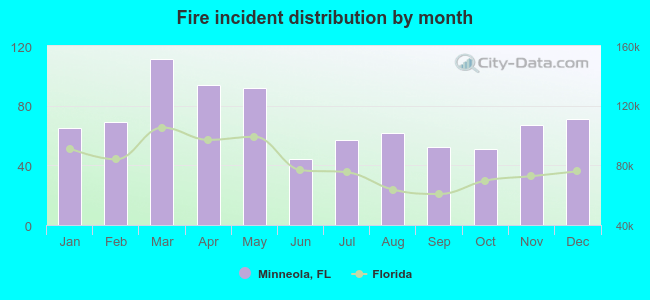 According to the 835 incident reports from years 2002 - 2018 most fires (13.3%) took place during March, and the least (5.3%) in June.
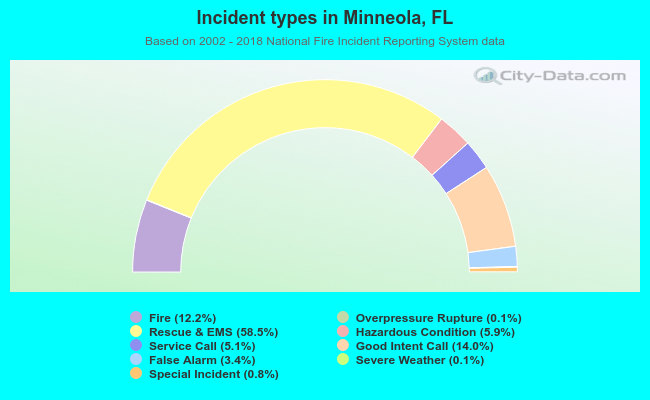 Out of all 6,844 cases reported during the years 2002 - 2018, the most belonged to the categories: Rescue & EMS (58.5%), Good Intent Call (14.0%), and Fire (12.2%).
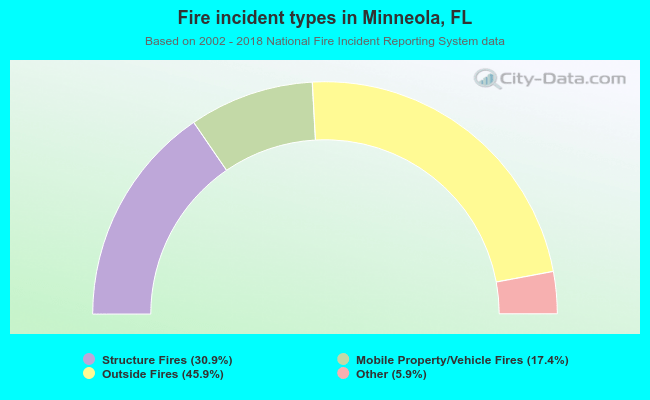 When looking into fire subcategories, the most reports belonged to: Outside Fires (45.9%), and Structure Fires (30.9%).