Apopka: Fire Incidents, Florida (FL)
Where are fire incidents reported in Apopka, FL
Something went wrong! Please refresh the page.
| Fire incidents reported | |
|---|---|
| Sreet name | Count |
| ORANGE BLOSSOM TR | 226 |
| ORANGE BLOSSOM TR | 126 |
| SEMORAN BLVD | 126 |
| MAIN ST | 120 |
| APOPKA BLVD | 72 |
| ROCK SPRINGS RD | 64 |
| WESTERN BELT | 64 |
| BINION RD | 62 |
| PARK AV | 56 |
| SR 436 | 52 |
| KEENE RD | 50 |
| MAIN ST | 48 |
| SEMORAN BLVD | 46 |
| ORANGE BLOSSOM TRL | 42 |
| LAKE BRIDGE LN | 40 |
| PARK AV | 38 |
| PLYMOUTH SORRENTO RD | 36 |
| CLARCONA | 34 |
| OCOEE APOPKA RD | 34 |
| 7TH ST | 32 |
| WESTERN BELTWAY | 32 |
| HAWTHORNE AV | 30 |
| 10TH ST | 28 |
| KELLY PARK RD | 28 |
| OLD DIXIE HWY | 28 |
| CLEVELAND ST | 26 |
| MICHAEL GLADDEN BLVD | 26 |
| ORANGE ST | 26 |
| VICK RD | 26 |
| BRADSHAW RD | 24 |
| Other | 1,546 |
2003 - 2018 National Fire Incident Reporting System (NFIRS) incidents
- Incident types reported to NFIRS in Apopka, FL
- 16,40451.0%Rescue & EMS
- 4,68414.6%Hazardous Condition
- 3,1889.9%Fire
- 3,1359.7%Service Call
- 2,7528.6%False Alarm
- 1,7495.4%Good Intent Call
- 1590.5%Special Incident
- 740.2%Severe Weather
- Fire incident types reported to NFIRS in Apopka, FL
- 1,29140.5%Outside Fires
- 97230.5%Structure Fires
- 73523.1%Mobile Property/Vehicle Fires
- 1906.0%Other
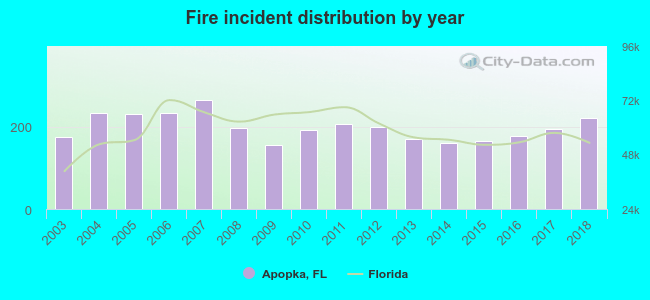 According to the data from the years 2003 - 2018 the average number of fire incidents per year is 199. The highest number of reported fire incidents - 265 took place in 2007, and the least - 156 in 2009. The data has an increasing trend.
The average number of yearly fire incidents per 10k residents in Apopka, FL compared to nearest cities:
(Note: Based on data for the last 3 years, including only cities with population 5,000 and above)
| Apopka: | 42.1 |
| Ocoee: | 36.9 |
| Altamonte Springs: | 16.7 |
| Winter Garden: | 38.1 |
| Maitland: | 21.6 |
| Fern Park: | 13.8 |
| Longwood: | 38.7 |
| Winter Park: | 32.9 |
| Casselberry: | 16.5 |
 The median response time based on all reported fire incidents is 5 minutes. This is lower compared to the Florida median value.
The median response time in Apopka, FL compared to nearest cities:
(Note: Based on data for all years, including only cities with at least 500 fire incidents)
| Apopka: | 5 minutes |
| Ocoee: | 6 minutes |
| Altamonte Springs: | 5 minutes |
| Winter Garden: | 6 minutes |
| Maitland: | 5 minutes |
| Sorrento: | 8 minutes |
| Longwood: | 5 minutes |
| Winter Park: | 6 minutes |
| Casselberry: | 5 minutes |
 According to the reports from the years 2003 - 2018 the average number of fire-related yearly deaths is 1. The highest number of reported deaths - 3 took place in 2018, and the lowest - 0 in 2003. The data has a growing trend.
The average number of fatalities per 1,000 fire incidents is 2. This indicator was the highest - 14 in 2018, and the lowest 0 in 2003. The trend for fatalities per 1,000 fires is rising. Compared to the Florida value the number of fatalities per 1,000 fires is higher.
According to the reports from the years 2003 - 2018 the average number of fire-related yearly deaths is 1. The highest number of reported deaths - 3 took place in 2018, and the lowest - 0 in 2003. The data has a growing trend.
The average number of fatalities per 1,000 fire incidents is 2. This indicator was the highest - 14 in 2018, and the lowest 0 in 2003. The trend for fatalities per 1,000 fires is rising. Compared to the Florida value the number of fatalities per 1,000 fires is higher.
 Based on the reports from the years 2003 - 2018 the average number of fire-related casualties per year is 2. The highest number of casualties - 5 took place in 2013, and the lowest - 1 in 2006. The data has an increasing trend.
The average number of casualties per 1,000 fires is 12. This indicator was the highest - 29 in 2013, and the lowest 4 in 2007. The trend for injuries per 1,000 fire incidents is rising. Compared to the Florida value the number of injuries per 1,000 fires is similar.
Based on the reports from the years 2003 - 2018 the average number of fire-related casualties per year is 2. The highest number of casualties - 5 took place in 2013, and the lowest - 1 in 2006. The data has an increasing trend.
The average number of casualties per 1,000 fires is 12. This indicator was the highest - 29 in 2013, and the lowest 4 in 2007. The trend for injuries per 1,000 fire incidents is rising. Compared to the Florida value the number of injuries per 1,000 fires is similar.Casualties per 1,000 incidents in Apopka, FL compared to nearest cities:
(Note: Based on data for all years, including only cities with at least 500 fire incidents)
| Apopka: | 11.3 |
| Ocoee: | 2.6 |
| Altamonte Springs: | 43.1 |
| Winter Garden: | 9.0 |
| Maitland: | 14.0 |
| Sorrento: | 5.4 |
| Longwood: | 29.7 |
| Winter Park: | 24.3 |
| Casselberry: | 20.4 |
 28.8% incidents where reported in the morning and 71.2% in the evening. The most fires (15.7%) took place on Saturday, and the least (13.0%) on Thursday.
 Based on the 3,188 reports from years 2003 - 2018 most fires (10.1%) took place during March, and the least (6.8%) in September.
 Out of all 32,165 cases reported during the years 2003 - 2018, the most belonged to the categories: Rescue & EMS (51.0%), Hazardous Condition (14.6%), and Fire (9.9%).
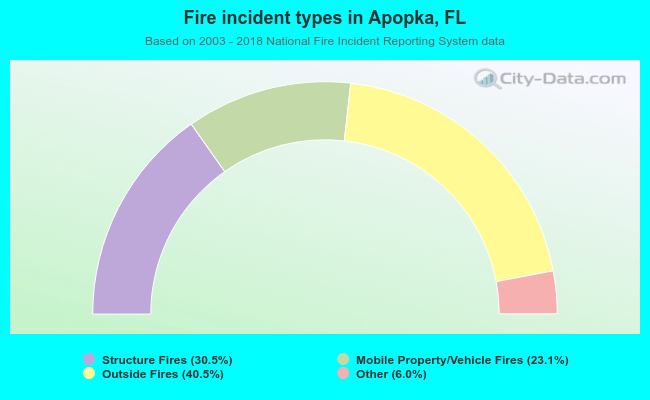 When looking into fire subcategories, the most incidents belonged to: Outside Fires (40.5%), and Structure Fires (30.5%).