Orlando: Fire Incidents, Florida (FL)
Where are fire incidents reported in Orlando, FL
Something went wrong! Please refresh the page.
| Fire incidents reported | |
|---|---|
| Sreet name | Count |
| COLONIAL DR | 1,202 |
| KIRKMAN RD | 962 |
| SEMORAN BLVD | 836 |
| ORANGE AVE | 658 |
| CURRY FORD RD | 574 |
| ORANGE BLOSSOM TRL | 510 |
| CONWAY RD | 478 |
| JOHN YOUNG PKY | 460 |
| INTERNATIONAL DR | 432 |
| MERCY DR | 428 |
| AIRPORT BLVD | 388 |
| RALEIGH ST | 330 |
| CONROY RD | 328 |
| CHURCH ST | 304 |
| UNIVERSAL STUDIOS PLZ | 270 |
| MICHIGAN ST | 258 |
| WASHINGTON ST | 246 |
| RIO GRANDE AVE | 238 |
| CENTRAL BLVD | 234 |
| SOUTH ST | 226 |
| MILLENIA BLVD | 222 |
| JACKSON ST | 210 |
| VINELAND RD | 202 |
| L B MCLEOD RD | 198 |
| HIAWASSEE RD | 192 |
| COLUMBIA ST | 190 |
| IVEY LN | 184 |
| LEEVISTA BLVD | 184 |
| ORANGE BLOSSOM | 172 |
| BENT PINE DR | 170 |
| Other | 11,369 |
2003 - 2018 National Fire Incident Reporting System (NFIRS) incidents
- Incident types reported to NFIRS in Orlando, FL
- 389,30272.8%Rescue & EMS
- 49,1269.2%Good Intent Call
- 32,6316.1%False Alarm
- 22,6554.2%Fire
- 20,2563.8%Hazardous Condition
- 15,4362.9%Service Call
- 4,8940.9%Special Incident
- Fire incident types reported to NFIRS in Orlando, FL
- 9,17640.5%Structure Fires
- 7,63533.7%Outside Fires
- 5,30423.4%Mobile Property/Vehicle Fires
- 5402.4%Other
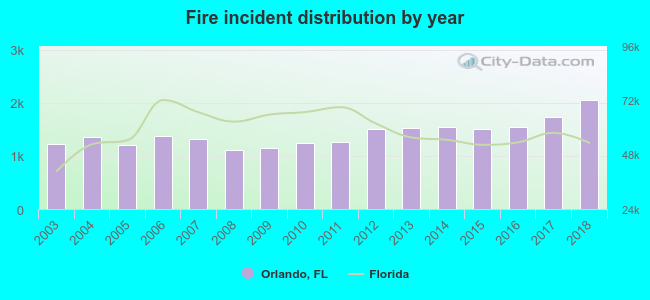 According to the data from the years 2003 - 2018 the average number of fire incidents per year is 1,414. The highest number of fire incidents - 2,046 took place in 2018, and the least - 1,105 in 2008. The data has an increasing trend.
The average number of yearly fire incidents per 10k residents in Orlando, FL compared to nearest cities:
(Note: Based on data for the last 3 years, including only cities with population 5,000 and above)
| Orlando: | 67.7 |
| Winter Park: | 32.9 |
| Belle Isle: | 4.6 |
| Maitland: | 21.6 |
| Fern Park: | 13.8 |
| Altamonte Springs: | 16.7 |
| Casselberry: | 16.5 |
| Ocoee: | 36.9 |
| Longwood: | 38.7 |
 The median response time based on all reported fire incidents is 7 minutes. This is about the same as the Florida median value.
The median response time in Orlando, FL compared to nearest cities:
(Note: Based on data for all years, including only cities with at least 500 fire incidents)
| Orlando: | 7 minutes |
| Winter Park: | 6 minutes |
| Maitland: | 5 minutes |
| Altamonte Springs: | 5 minutes |
| Casselberry: | 5 minutes |
| Ocoee: | 6 minutes |
| Longwood: | 5 minutes |
| Winter Springs: | 5 minutes |
| Winter Garden: | 6 minutes |
 Based on the reports from the years 2003 - 2018 the average number of fire-related yearly deaths is 2. The highest number of reported deaths - 5 took place in 2018, and the lowest - 0 in 2005. The data has a growing trend.
The average number of fatalities per 1,000 fires is 1. This indicator was the highest - 3 in 2012, and the lowest 0 in 2005. The trend for deaths per 1,000 incidents is growing. Compared to the state value the number of fatalities per 1,000 incidents is lower.
Based on the reports from the years 2003 - 2018 the average number of fire-related yearly deaths is 2. The highest number of reported deaths - 5 took place in 2018, and the lowest - 0 in 2005. The data has a growing trend.
The average number of fatalities per 1,000 fires is 1. This indicator was the highest - 3 in 2012, and the lowest 0 in 2005. The trend for deaths per 1,000 incidents is growing. Compared to the state value the number of fatalities per 1,000 incidents is lower.
 According to the reports from the years 2003 - 2018 the average number of fire-related casualties per year is 27. The highest number of reported injuries - 47 took place in 2004, and the lowest - 9 in 2017. The data has a dropping trend.
The average number of casualties per 1,000 fire incidents is 20. This indicator was the highest - 38 in 2003, and the lowest 5 in 2017. The trend for injuries per 1,000 fire incidents is dropping. Compared to the Florida value the number of injuries per 1,000 fire incidents is higher.
According to the reports from the years 2003 - 2018 the average number of fire-related casualties per year is 27. The highest number of reported injuries - 47 took place in 2004, and the lowest - 9 in 2017. The data has a dropping trend.
The average number of casualties per 1,000 fire incidents is 20. This indicator was the highest - 38 in 2003, and the lowest 5 in 2017. The trend for injuries per 1,000 fire incidents is dropping. Compared to the Florida value the number of injuries per 1,000 fire incidents is higher.Casualties per 1,000 incidents in Orlando, FL compared to nearest cities:
(Note: Based on data for all years, including only cities with at least 500 fire incidents)
| Orlando: | 19.3 |
| Winter Park: | 24.3 |
| Maitland: | 14.0 |
| Altamonte Springs: | 43.1 |
| Casselberry: | 20.4 |
| Ocoee: | 2.6 |
| Longwood: | 29.7 |
| Winter Springs: | 36.7 |
| Winter Garden: | 9.0 |
 31.5% incidents where reported in the morning and 68.5% in the evening. The most fires (15.2%) took place on Sunday, and the least (13.3%) on Wednesday.
 According to the 22,655 fires from years 2003 - 2018 most fires (10.9%) took place during March, and the least (6.7%) in September.
 Out of all 534,585 cases reported during the years 2003 - 2018, the most belonged to the categories: Rescue & EMS (72.8%), Good Intent Call (9.2%), and False Alarm (6.1%).
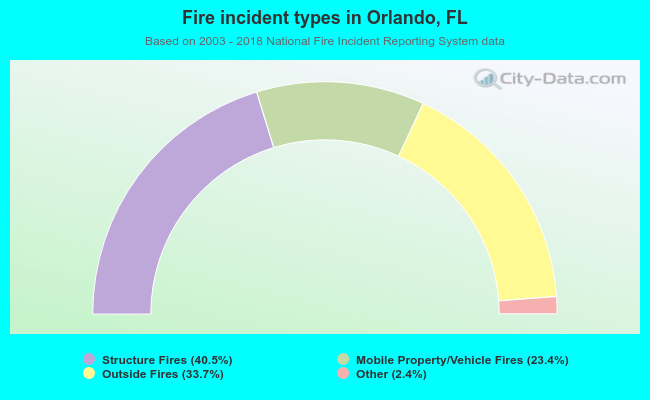 When looking into fire subcategories, the most incidents belonged to: Structure Fires (40.5%), and Outside Fires (33.7%).