Ocoee: Fire Incidents, Florida (FL)
Where are fire incidents reported in Ocoee, FL
Something went wrong! Please refresh the page.
| Fire incidents reported | |
|---|---|
| Sreet name | Count |
| COLONIAL DR | 288 |
| OCOEE APOPKA RD | 128 |
| SILVER STAR RD | 106 |
| CLARKE RD | 94 |
| LAKEWOOD AVE | 66 |
| 1-UPDATE STREETS | 54 |
| OLD WINTER GARDEN RD | 52 |
| MAGUIRE RD | 48 |
| BLUFORD AVE | 46 |
| CLARCONA OCOEE RD | 46 |
| ADAIR ST | 44 |
| WEST RD | 42 |
| CIRCLE KEY DR | 36 |
| SUNSHINE STATE PKY | 30 |
| WURST RD | 30 |
| FULLERS CROSS RD | 28 |
| PINE ST | 28 |
| LAKESHORE DR | 26 |
| VIZCAYA LAKE RD | 24 |
| FLEWELLING AVE | 22 |
| FRANKLIN ST | 22 |
| HOBSON RD | 22 |
| PALM DR | 22 |
| A D MIMS RD | 20 |
| ERVING CIR | 18 |
| GENEVA ST | 18 |
| LITTLE SPRING HILL DR | 18 |
| 11TH AVE | 16 |
| 429 BEL | 16 |
| BLACKWOOD AVE | 16 |
| Other | 485 |
2003 - 2018 National Fire Incident Reporting System (NFIRS) incidents
- Incident types reported to NFIRS in Ocoee, FL
- 14,44561.0%Rescue & EMS
- 3,34214.1%Good Intent Call
- 1,9118.1%Fire
- 1,4286.0%Hazardous Condition
- 1,4136.0%False Alarm
- 1,0614.5%Service Call
- 330.1%Special Incident
- Fire incident types reported to NFIRS in Ocoee, FL
- 77140.3%Outside Fires
- 64633.8%Structure Fires
- 33017.3%Mobile Property/Vehicle Fires
- 1648.6%Other
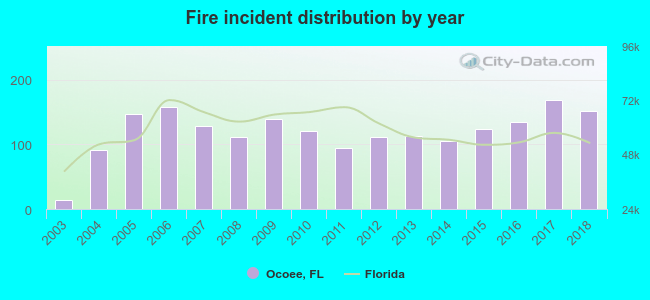 Based on the data from the years 2003 - 2018 the average number of fires per year is 119. The highest number of reported fires - 168 took place in 2017, and the least - 14 in 2003. The data has a growing trend.
The average number of yearly fire incidents per 10k residents in Ocoee, FL compared to nearest cities:
(Note: Based on data for the last 3 years, including only cities with population 5,000 and above)
| Ocoee: | 36.9 |
| Winter Garden: | 38.1 |
| Apopka: | 42.1 |
| Orlando: | 67.7 |
| Altamonte Springs: | 16.7 |
| Maitland: | 21.6 |
| Winter Park: | 32.9 |
| Fern Park: | 13.8 |
| Minneola: | 39.9 |
 The median response time based on all reported fire incidents is 6 minutes. This is close to the state median value.
The median response time in Ocoee, FL compared to nearest cities:
(Note: Based on data for all years, including only cities with at least 500 fire incidents)
| Ocoee: | 6 minutes |
| Winter Garden: | 6 minutes |
| Apopka: | 5 minutes |
| Orlando: | 7 minutes |
| Altamonte Springs: | 5 minutes |
| Maitland: | 5 minutes |
| Winter Park: | 6 minutes |
| Minneola: | 7 minutes |
| Clermont: | 7 minutes |
 According to the data from the years 2003 - 2018 the average number of fire-related yearly casualties is 0. The highest number of injuries - 2 took place in 2010, and the lowest - 0 in 2003. The data has an increasing trend.
The average number of casualties per 1,000 fire incidents is 2. This indicator was the highest - 17 in 2010, and the lowest 0 in 2003. The trend for casualties per 1,000 fire incidents is growing. Compared to the Florida value the number of injuries per 1,000 fires is much lower.
According to the data from the years 2003 - 2018 the average number of fire-related yearly casualties is 0. The highest number of injuries - 2 took place in 2010, and the lowest - 0 in 2003. The data has an increasing trend.
The average number of casualties per 1,000 fire incidents is 2. This indicator was the highest - 17 in 2010, and the lowest 0 in 2003. The trend for casualties per 1,000 fire incidents is growing. Compared to the Florida value the number of injuries per 1,000 fires is much lower.Casualties per 1,000 incidents in Ocoee, FL compared to nearest cities:
(Note: Based on data for all years, including only cities with at least 500 fire incidents)
| Ocoee: | 2.6 |
| Winter Garden: | 9.0 |
| Apopka: | 11.3 |
| Orlando: | 19.3 |
| Altamonte Springs: | 43.1 |
| Maitland: | 14.0 |
| Winter Park: | 24.3 |
| Minneola: | 3.6 |
| Clermont: | 6.8 |
 28.2% incidents where reported in the morning and 71.8% in the evening. The most fires (16.4%) took place on Monday, and the least (12.9%) on Sunday.
 According to the 1,911 fire incident reports from years 2003 - 2018 most fires (10.3%) took place during December, and the least (6.4%) in September.
 Out of all 23,662 cases reported during the years 2003 - 2018, the most belonged to the categories: Rescue & EMS (61.0%), Good Intent Call (14.1%), and Fire (8.1%).
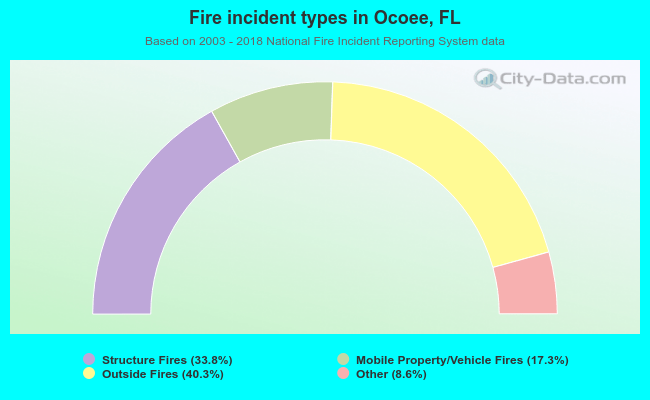 When looking into fire subcategories, the most incidents belonged to: Outside Fires (40.3%), and Structure Fires (33.8%).