Leesburg: Fire Incidents, Florida (FL)
Where are fire incidents reported in Leesburg, FL
Something went wrong! Please refresh the page.
| Fire incidents reported | |
|---|---|
| Sreet name | Count |
| US HWY 441 | 216 |
| 14TH ST | 176 |
| MAIN ST | 142 |
| US HWY 27 | 140 |
| CITRUS BLVD | 118 |
| CR 44 | 94 |
| GRIFFIN RD | 86 |
| CR 33 | 84 |
| SUNNYSIDE DR | 84 |
| NORTH BLVD | 76 |
| SOUTH ST | 72 |
| CR 48 | 62 |
| DIXIE AVE | 62 |
| 441 | 50 |
| EMERALDA ISLAND RD | 50 |
| THOMAS AVE | 48 |
| TURNPIKE | 48 |
| COLONIAL ST | 46 |
| CR 452 | 46 |
| CR 473 | 38 |
| HWY 27 | 38 |
| CR 468 | 34 |
| GOOSE PRAIRIE RD | 34 |
| MONTCLAIR RD | 34 |
| SANDY OAK CIR | 34 |
| SR 44 | 34 |
| WESTMONT RD | 34 |
| BIRCHWOOD CT | 32 |
| PRUITT ST | 32 |
| PICCIOLA RD | 30 |
| Other | 1,893 |
2002 - 2018 National Fire Incident Reporting System (NFIRS) incidents
- Incident types reported to NFIRS in Leesburg, FL
- 43,92167.1%Rescue & EMS
- 8,79913.4%Good Intent Call
- 4,4716.8%Service Call
- 3,9676.1%Fire
- 2,1483.3%Hazardous Condition
- 2,0463.1%False Alarm
- 660.1%Special Incident
- Fire incident types reported to NFIRS in Leesburg, FL
- 1,74644.0%Outside Fires
- 1,33333.6%Structure Fires
- 72918.4%Mobile Property/Vehicle Fires
- 1594.0%Other
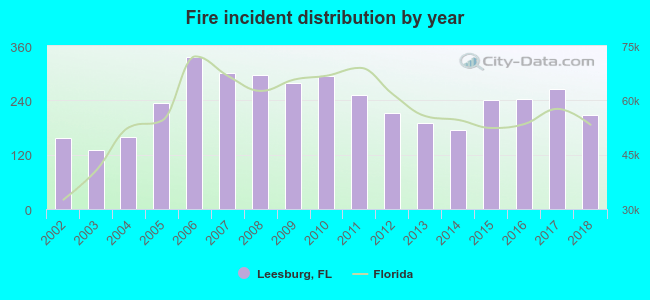 According to the data from the years 2002 - 2018 the average number of fires per year is 233. The highest number of fire incidents - 336 took place in 2006, and the least - 131 in 2003. The data has an increasing trend.
The average number of yearly fire incidents per 10k residents in Leesburg, FL compared to nearest cities:
(Note: Based on data for the last 3 years, including only cities with population 5,000 and above)
| Leesburg: | 110.9 |
| Lady Lake: | 50.0 |
| Tavares: | 64.1 |
| Wildwood: | 141.6 |
| The Villages: | 6.6 |
| Eustis: | 66.1 |
| Mount Dora: | 58.9 |
| Mascotte: | 58.0 |
| Groveland: | 139.3 |
 The median response time based on all reported fire incidents is 7 minutes. This is comparable to the state median value.
The median response time in Leesburg, FL compared to nearest cities:
(Note: Based on data for all years, including only cities with at least 500 fire incidents)
| Leesburg: | 7 minutes |
| Fruitland Park: | 7 minutes |
| Lady Lake: | 7 minutes |
| Tavares: | 6 minutes |
| Wildwood: | 8 minutes |
| The Villages: | 5 minutes |
| Eustis: | 7 minutes |
| Mount Dora: | 6 minutes |
| Umatilla: | 9 minutes |
 According to the data from the years 2002 - 2018 the average number of fire-related yearly deaths is 0. The highest number of reported deaths - 2 took place in 2002, and the lowest - 0 in 2006. The data has a dropping trend.
The average number of fatalities per 1,000 fires is 2. This indicator was the highest - 13 in 2002, and the lowest 0 in 2006. The trend for deaths per 1,000 fires is dropping. Compared to the Florida value the number of deaths per 1,000 fire incidents is similar.
According to the data from the years 2002 - 2018 the average number of fire-related yearly deaths is 0. The highest number of reported deaths - 2 took place in 2002, and the lowest - 0 in 2006. The data has a dropping trend.
The average number of fatalities per 1,000 fires is 2. This indicator was the highest - 13 in 2002, and the lowest 0 in 2006. The trend for deaths per 1,000 fires is dropping. Compared to the Florida value the number of deaths per 1,000 fire incidents is similar.
 Based on the data from the years 2002 - 2018 the average number of fire-related yearly casualties is 1. The highest number of injuries - 4 took place in 2009, and the lowest - 0 in 2002. The data has a growing trend.
The average number of injuries per 1,000 fires is 5. This indicator was the highest - 15 in 2003, and the lowest 0 in 2002. The trend for casualties per 1,000 fire incidents is rising. Compared to the Florida value the number of injuries per 1,000 fire incidents is much lower.
Based on the data from the years 2002 - 2018 the average number of fire-related yearly casualties is 1. The highest number of injuries - 4 took place in 2009, and the lowest - 0 in 2002. The data has a growing trend.
The average number of injuries per 1,000 fires is 5. This indicator was the highest - 15 in 2003, and the lowest 0 in 2002. The trend for casualties per 1,000 fire incidents is rising. Compared to the Florida value the number of injuries per 1,000 fire incidents is much lower.Casualties per 1,000 incidents in Leesburg, FL compared to nearest cities:
(Note: Based on data for all years, including only cities with at least 500 fire incidents)
| Leesburg: | 4.8 |
| Fruitland Park: | 2.4 |
| Lady Lake: | 3.0 |
| Tavares: | 2.5 |
| Wildwood: | 6.6 |
| The Villages: | 6.6 |
| Eustis: | 5.8 |
| Mount Dora: | 11.7 |
| Umatilla: | 0.8 |
 27.6% incidents where reported in the morning and 72.4% in the evening. The most fires (15.1%) took place on Friday, and the least (13.6%) on Sunday.
 According to the 3,967 fire incidents from years 2002 - 2018 most fires (11.0%) took place during May, and the least (6.1%) in August.
 Out of all 65,474 cases reported during the years 2002 - 2018, the most belonged to the categories: Rescue & EMS (67.1%), Good Intent Call (13.4%), and Service Call (6.8%).
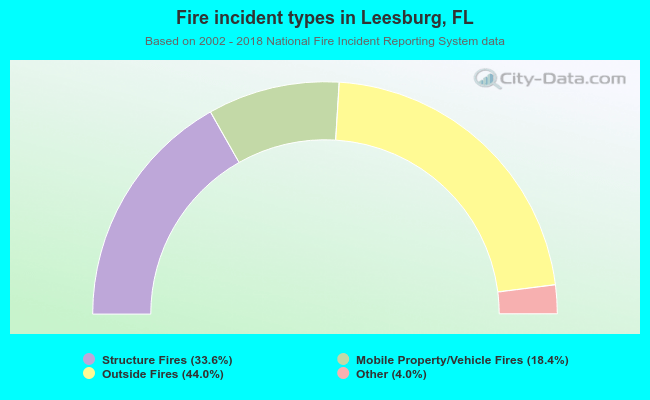 When looking into fire subcategories, the most reports belonged to: Outside Fires (44.0%), and Structure Fires (33.6%).