Groveland: Fire Incidents, Florida (FL)
Where are fire incidents reported in Groveland, FL
Something went wrong! Please refresh the page.
| Fire incidents reported | |
|---|---|
| Sreet name | Count |
| BAY LAKE RD | 128 |
| BROAD ST | 98 |
| CR 33 | 84 |
| EMPIRE CHURCH RD | 84 |
| MOUNT PLEASANT RD | 72 |
| SR 33 | 68 |
| TUSCANOOGA RD | 54 |
| SLOANS RIDGE RD | 50 |
| VILLA CITY RD | 50 |
| SR 50 | 48 |
| LAKE ERIE RD | 46 |
| REDWING RD | 46 |
| SR 19 | 46 |
| TIMBER VILLAGE RD | 46 |
| US HWY 27 | 44 |
| 50 HWY | 38 |
| GROVELAND FARMS RD | 38 |
| SOTO RD | 38 |
| BAPTIST ISLAND RD | 36 |
| MASCOTTE EMPIRE RD | 36 |
| MAX HOOKS RD | 36 |
| MILLSTREAM DR | 34 |
| PHILLIPS RD | 34 |
| 33 | 32 |
| CARTER JONES RD | 32 |
| CHERRY LAKE RD | 30 |
| LOOP RD | 30 |
| YOUTH CAMP RD | 30 |
| BLUFF VIEW DR | 28 |
| MONTEVISTA RD | 28 |
| Other | 660 |
2002 - 2018 National Fire Incident Reporting System (NFIRS) incidents
- Incident types reported to NFIRS in Groveland, FL
- 8,18357.8%Rescue & EMS
- 2,12415.0%Fire
- 1,85513.1%Good Intent Call
- 7295.2%Hazardous Condition
- 6014.2%False Alarm
- 5944.2%Service Call
- 390.3%Special Incident
- 160.1%Severe Weather
- Fire incident types reported to NFIRS in Groveland, FL
- 1,20856.9%Outside Fires
- 48622.9%Structure Fires
- 31514.8%Mobile Property/Vehicle Fires
- 1155.4%Other
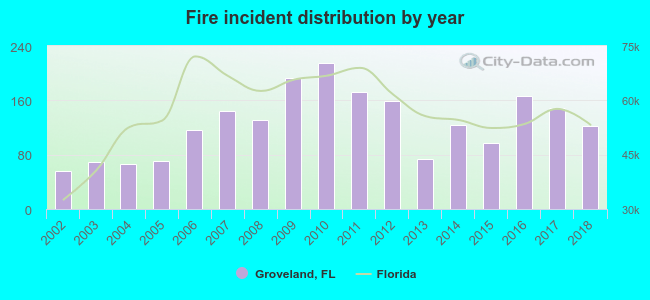 Based on the data from the years 2002 - 2018 the average number of fire incidents per year is 125. The highest number of reported fire incidents - 215 took place in 2010, and the least - 56 in 2002. The data has a rising trend.
The average number of yearly fire incidents per 10k residents in Groveland, FL compared to nearest cities:
(Note: Based on data for the last 3 years, including only cities with population 5,000 and above)
| Groveland: | 139.3 |
| Mascotte: | 58.0 |
| Clermont: | 66.8 |
| Minneola: | 39.9 |
| Winter Garden: | 38.1 |
| Leesburg: | 110.9 |
| Tavares: | 64.1 |
| Ocoee: | 36.9 |
| Mount Dora: | 58.9 |
 The median response time based on all reported fire incidents is 8 minutes. This is higher than the state median value.
The median response time in Groveland, FL compared to nearest cities:
(Note: Based on data for all years, including only cities with at least 500 fire incidents)
| Groveland: | 8 minutes |
| Clermont: | 7 minutes |
| Minneola: | 7 minutes |
| Webster: | 10 minutes |
| Winter Garden: | 6 minutes |
| Bushnell: | 7 minutes |
| Leesburg: | 7 minutes |
| Tavares: | 6 minutes |
| Ocoee: | 6 minutes |
 Based on the data from the years 2002 - 2018 the average number of fire-related yearly casualties is 0. The highest number of reported casualties - 3 took place in 2009, and the lowest - 0 in 2002. The data has a constant trend.
The average number of casualties per 1,000 fires is 3. This indicator was the highest - 16 in 2009, and the lowest 0 in 2002. The trend for injuries per 1,000 fires is constant. Compared to the Florida value the number of injuries per 1,000 fire incidents is much lower.
Based on the data from the years 2002 - 2018 the average number of fire-related yearly casualties is 0. The highest number of reported casualties - 3 took place in 2009, and the lowest - 0 in 2002. The data has a constant trend.
The average number of casualties per 1,000 fires is 3. This indicator was the highest - 16 in 2009, and the lowest 0 in 2002. The trend for injuries per 1,000 fires is constant. Compared to the Florida value the number of injuries per 1,000 fire incidents is much lower.
 26.3% incidents where reported in the morning and 73.7% in the evening. The most fires (16.3%) took place on Saturday, and the least (12.7%) on Tuesday.
 According to the 2,124 fire incidents from years 2002 - 2018 most fires (12.0%) took place during March, and the least (4.1%) in August.
 Out of all 14,152 cases reported during the years 2002 - 2018, the most belonged to the categories: Rescue & EMS (57.8%), Fire (15.0%), and Good Intent Call (13.1%).
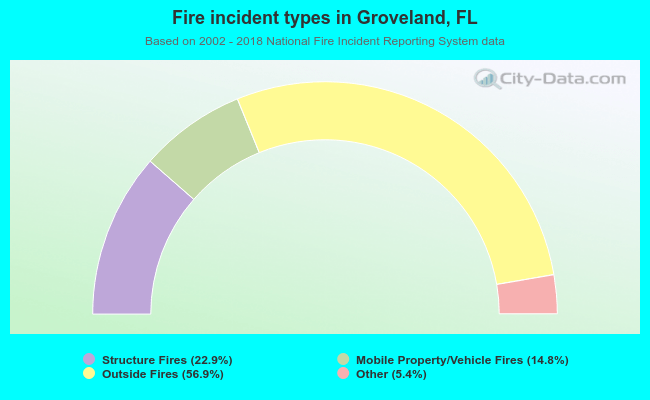 When looking into fire subcategories, the most incidents belonged to: Outside Fires (56.9%), and Structure Fires (22.9%).