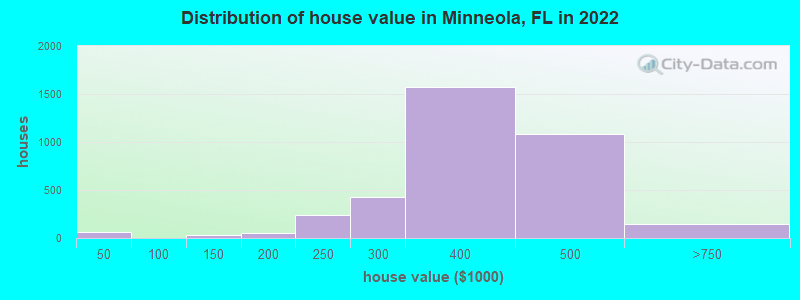
Estimated median house or condo value in 2022: $408,079 (it was $106,300 in 2000)
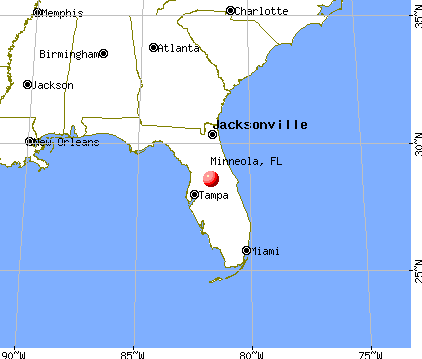
Minneola:
$408,079
FL:
$354,100
Mean prices in 2022:all housing units: $343,158; detached houses: $390,745; townhouses or other attached units: $264,777; in 2-unit structures: $231,804; in 3-to-4-unit structures: $250,602; in 5-or-more-unit structures: $482,936; mobile homes: $133,722; occupied boats, rvs, vans, etc.: $27,315
Median gross rent in 2022: $1,892.
March 2022 cost of living index in Minneola: 92.1 (less than average, U.S. average is 100)
Percentage of residents living in poverty in 2022: 4.2%
(1.8% for White Non-Hispanic residents, 17.0% for Black residents, 3.5% for Hispanic or Latino residents, 10.7% for other race residents, 0.4% for two or more races residents)
According to our research of Florida and other state lists, there were 9 registered sex offenders living in Minneola, Florida as of May 16, 2024. The ratio of all residents to sex offenders in Minneola is 1,217 to 1. The ratio of registered sex offenders to all residents in this city is lower than the state average.
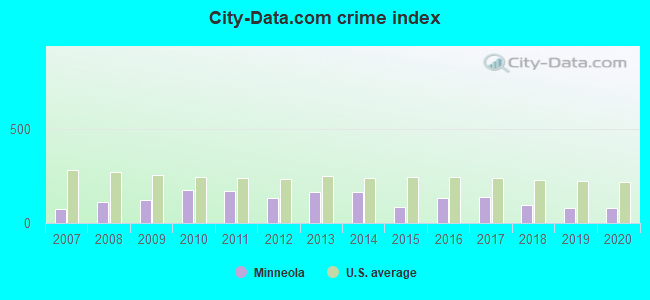
Crime rates in Minneola by year
Type
2009
2010
2011
2012
2013
2014
2015
2016
2017
2018
2019
2020
Murders (per 100,000)
0 (0.0)
0 (0.0)
0 (0.0)
0 (0.0)
0 (0.0)
0 (0.0)
0 (0.0)
0 (0.0)
0 (0.0)
0 (0.0)
0 (0.0)
0 (0.0)
Rapes (per 100,000)
1 (10.5)
2 (21.3)
1 (10.5)
2 (20.7)
1 (10.2)
4 (39.3)
0 (0.0)
4 (36.3)
5 (44.0)
3 (25.3)
2 (16.0)
4 (30.8)
Robberies (per 100,000)
3 (31.5)
1 (10.6)
5 (52.5)
3 (31.1)
3 (30.5)
3 (29.5)
3 (28.4)
3 (27.3)
8 (70.4)
3 (25.3)
3 (24.0)
1 (7.7)
Assaults (per 100,000)
4 (42.1)
34 (361.6)
24 (251.8)
9 (93.2)
20 (203.6)
17 (166.9)
9 (85.1)
16 (145.4)
14 (123.1)
13 (109.6)
10 (80.0)
11 (84.6)
Burglaries (per 100,000)
46 (483.8)
42 (446.7)
50 (524.6)
48 (496.8)
75 (763.5)
58 (569.6)
39 (368.6)
27 (245.3)
33 (290.2)
22 (185.5)
21 (167.9)
14 (107.7)
Thefts (per 100,000)
114 (1,199)
105 (1,117)
124 (1,301)
112 (1,159)
123 (1,252)
118 (1,159)
71 (671.1)
126 (1,145)
83 (730.0)
83 (699.9)
71 (567.7)
65 (500.0)
Auto thefts (per 100,000)
17 (178.8)
9 (95.7)
10 (104.9)
6 (62.1)
7 (71.3)
5 (49.1)
7 (66.2)
7 (63.6)
10 (88.0)
9 (75.9)
16 (127.9)
13 (100.0)
Arson (per 100,000)
0 (0.0)
1 (10.6)
1 (10.5)
0 (0.0)
1 (10.2)
0 (0.0)
0 (0.0)
0 (0.0)
0 (0.0)
0 (0.0)
1 (8.0)
0 (0.0)
City-Data.com crime index
122.4
176.1
171.7
130.6
167.3
163.8
83.5
134.4
137.5
96.8
80.7
79.4
The City-Data.com crime index weighs serious crimes and violent crimes more heavily. Higher means more crime, U.S. average is 246.1. It adjusts for the number of visitors and daily workers commuting into cities.
Population density: 5,286 people per square mile (average).
2,333 residents are foreign born (9.1% Latin America, 3.3% Asia, 1.6% Europe).
This city:
15.3%
Florida:
21.1%
Median real estate property taxes paid for housing units with mortgages in 2022: $3,320 (0.8%) Median real estate property taxes paid for housing units with no mortgage in 2022: $3,095 (0.8%)
Nearest city with pop. 50,000+: Southwest Orange, FL (17.5 miles , pop. 105,946).
Nearest city with pop. 200,000+: Tampa, FL (60.6 miles , pop. 303,447).
Nearest city with pop. 1,000,000+: Houston, TX (827.1 miles , pop. 1,953,631).
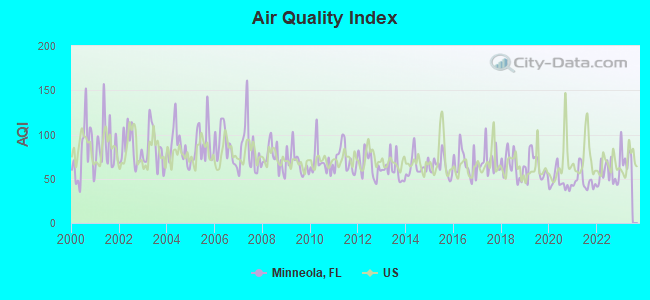
Air Quality Index (AQI) level in 2022 was 55.0. This is better than average.
City:
55.0
U.S.:
72.6
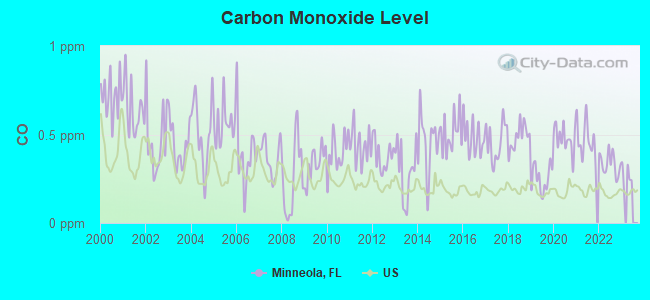
Carbon Monoxide (CO) [ppm] level in 2022 was 0.335. This is worse than average.Closest monitor was 22.5 miles away from the city center.
City:
0.335
U.S.:
0.251
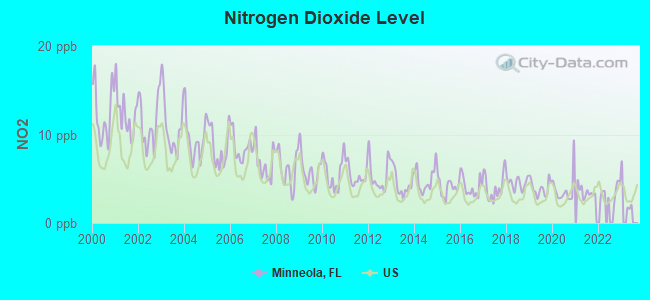
Nitrogen Dioxide (NO2) [ppb] level in 2022 was 3.57. This is significantly better than average.Closest monitor was 23.4 miles away from the city center.
City:
3.57
U.S.:
5.11
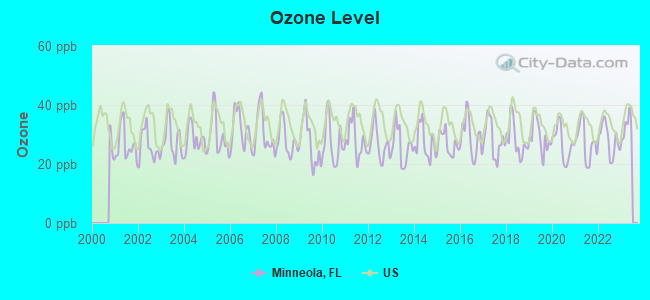
Ozone [ppb] level in 2022 was 28.3. This is about average.Closest monitor was 4.0 miles away from the city center.
City:
28.3
U.S.:
33.3
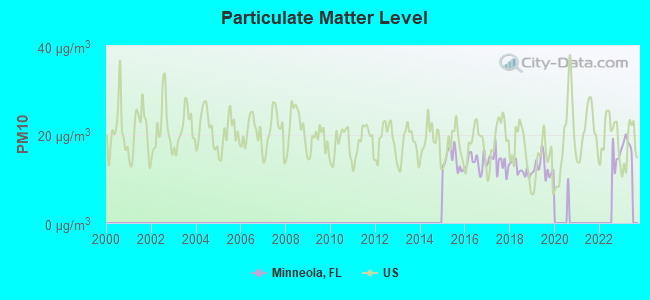
Particulate Matter (PM10) [µg/m3] level in 2019 was 12.6. This is significantly better than average.Closest monitor was 14.0 miles away from the city center.
City:
12.6
U.S.:
19.2
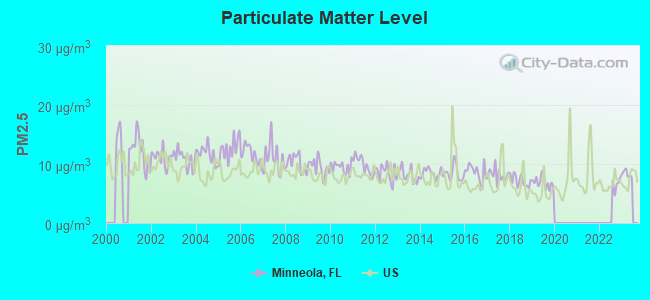
Particulate Matter (PM2.5) [µg/m3] level in 2019 was 6.89. This is about average.Closest monitor was 23.4 miles away from the city center.
City:
6.89
U.S.:
8.11
Tornado activity:
Minneola-area historical tornado activity is above Florida state average. It is 61% greater than the overall U.S. average.
On 2/22/1998, a category F3 (max. wind speeds 158-206 mph) tornado 7.0 miles away from the Minneola city center killed 3 peopleand injured 70 peopleand caused $15 million in damages.
On 3/19/1981, a category F3 tornado 20.6 miles away from the city center injured one personand causedbetween $500,000 and $5,000,000 in damages.
Earthquake activity:
Minneola-area historical earthquake activity is significantly above Florida state average. It is 88% smaller than the overall U.S. average.
On 9/10/2006 at 14:56:08, a magnitude 5.9 (5.9 MB, 5.5 MS, 5.8 MW, Class: Moderate, Intensity: VI - VII) earthquake occurred 340.3 miles away from the city center On 11/22/1974 at 05:25:55, a magnitude 4.7 (4.7 MB, Class: Light, Intensity: IV - V) earthquake occurred 313.7 miles away from the city center On 9/4/2016 at 18:29:29, a magnitude 3.8 (3.8 ML, Class: Light, Intensity: II - III) earthquake occurred 169.4 miles away from the city center On 6/23/2016 at 17:20:29, a magnitude 3.8 (3.8 ML) earthquake occurred 169.8 miles away from the city center On 9/21/2016 at 16:30:52, a magnitude 3.8 (3.8 ML) earthquake occurred 170.3 miles away from the city center On 8/2/1974 at 08:52:09, a magnitude 4.9 (4.3 MB, 4.9 LG) earthquake occurred 368.8 miles away from the city center Magnitude types: regional Lg-wave magnitude (LG), body-wave magnitude (MB), local magnitude (ML), surface-wave magnitude (MS), moment magnitude (MW)
Natural disasters:
The number of natural disasters in Lake County (18) is near the US average (15). Major Disasters (Presidential) Declared: 10 Emergencies Declared: 4
Causes of natural disasters: Hurricanes: 9, Fires: 3, Tornadoes: 3, Tropical Storms: 3, Flood: 1, Freeze: 1, Storm: 1, Wind: 1, Other: 1 (Note: some incidents may be assigned to more than one category).
Hospitals and medical centers in Minneola:
C AND J HOME HEALTH SERVICES LLC (506 S HWY 27 SUITE E)
Other hospitals and medical centers near Minneola:
PHOENIX HOME CARE INC (Home Health Center, about 3 miles away; CLERMONT, FL)
CLERMONT HEALTH AND REHABILITATION CENTER (Nursing Home, about 3 miles away; CLERMONT, FL)
COLONIAL LAKES HEALTH CARE (Nursing Home, about 9 miles away; WINTER GARDEN, FL)
HEALTH CENTRAL PARK (Nursing Home, about 10 miles away; WINTER GARDEN, FL)
CENTRAL FLORIDA KIDNEY CENTER - WINTER GARDEN (Dialysis Facility, about 11 miles away; WINTER GARDEN, FL)
WINTER GARDEN DIALYSIS (Dialysis Facility, about 11 miles away; WINTER GARDEN, FL)
QUALITY HEALTH OF ORANGE COUNTY (Nursing Home, about 11 miles away; WINTER GARDEN, FL)
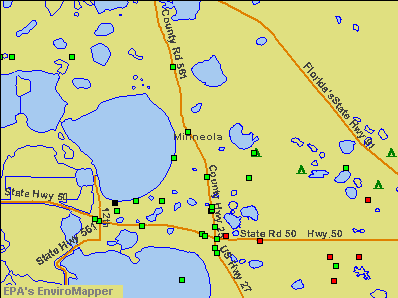
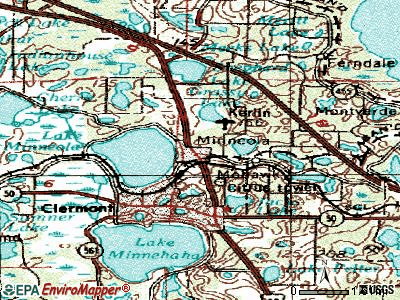
Notable locations in Minneola: City of Minneola Fire and Rescue Department (A), Minneola Fire / Rescue Station 90 (B), Lake - Sumter Emergency Medical Services Station 351 and D3 (C), Minneola City Hall (D). Display/hide their locations on the map
Churches in Minneola include: First Baptist Church of Wauchula (A), Christian and Missionary Alliance (B), Temple of The Living God (C). Display/hide their locations on the map
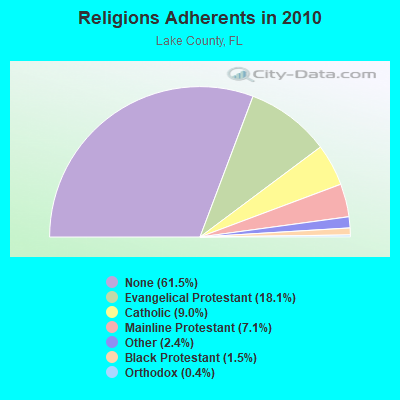
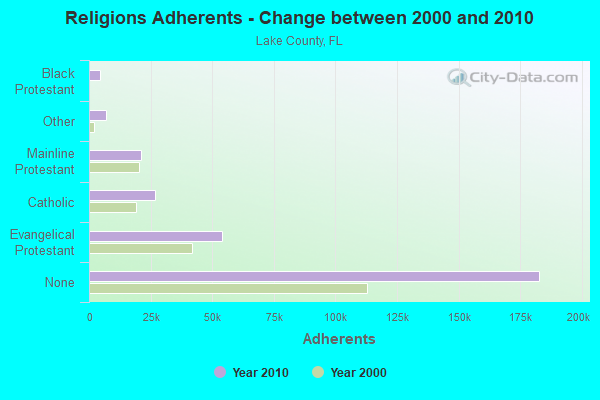
Religion statistics for Minneola, FL (based on Lake County data)
Religion
Adherents
Congregations
Evangelical Protestant
53,875
228
Catholic
26,872
7
Mainline Protestant
20,984
38
Other
7,028
22
Black Protestant
4,362
26
Orthodox
1,130
2
None
182,801
-
Source: Clifford Grammich, Kirk Hadaway, Richard Houseal, Dale E.Jones, Alexei Krindatch, Richie Stanley and Richard H.Taylor. 2012. 2010 U.S.Religion Census: Religious Congregations & Membership Study. Association of Statisticians of American Religious Bodies. Jones, Dale E., et al. 2002. Congregations and Membership in the United States 2000. Nashville, TN: Glenmary Research Center. Graphs represent county-level data
Aircraft: ZANE M SALBER SEAREY (Category: Amphibian, Seats: 2, Weight: Up to 12,499 Pounds), Engine: ROTAX 914ULS (115 HP) (4 Cycle) N-Number: 191MS, N191MS, N-191MS, Serial Number: M23J62S, Year manufactured: 2019, Airworthiness Date: 07/06/2019, Certificate Issue Date: 05/22/2019 Registrant (Individual): Zane M Salber, 213 E Baker St, Minneola, FL 34715
Aircraft: BELL ROBERT W PULSAR XP (Category: Land, Seats: 2, Weight: Up to 12,499 Pounds), Engine: BOMBARDIER ROTAX (ALL) (Reciprocating) N-Number: 199MB, N199MB, N-199MB, Serial Number: 151, Year manufactured: 1997, Airworthiness Date: 06/01/1997, Certificate Issue Date: 01/24/2013 Registrant (Individual): David P Kranz, 103 N Galena Ave, Minneola, FL 34715
Aircraft: GFS AIR LLC SEAREY (Category: Amphibian, Seats: 2, Weight: Up to 12,499 Pounds), Engine: ROTAX 914 SERIES (100 HP) (Reciprocating) N-Number: 41089, N41089, N-41089, Serial Number: 1MK455C, Year manufactured: 2009, Airworthiness Date: 03/14/2009, Certificate Issue Date: 10/13/2020 Registrant (Individual): Don Owens, 608 S Main Ave Unit 23, Minneola, FL 34715
Aircraft: PIPER PA-28-140 (Category: Land, Seats: 4, Weight: Up to 12,499 Pounds, Speed: 107 mph), Engine: LYCOMING 0-320 SERIES (180 HP) (Reciprocating) N-Number: 6077W, N6077W, N-6077W, Serial Number: 28-20090, Year manufactured: 1964, Airworthiness Date: 05/13/1964, Certificate Issue Date: 05/21/2012 Registrant (Individual): Stephen W Parrish, 508 S Main Ave, Minneola, FL 34715
Aircraft: KING RALPH W SEAREY (Category: Amphibian, Seats: 2, Weight: Up to 12,499 Pounds), Engine: ROTAX 912S (100 HP) (4 Cycle) N-Number: 9042X, N9042X, N-9042X, Serial Number: 1MK347C, Year manufactured: 2004, Airworthiness Date: 12/06/2004, Certificate Issue Date: 02/04/2016 Registrant (Individual): Ralph W King, Po Box 267, Minneola, FL 34755
Aircraft: LOWE JOHN F BUCCANEER II (Category: Amphibian, Seats: 2, Weight: Up to 12,499 Pounds), Engine: BOMBARDIER ROTAX (ALL) (Reciprocating) N-Number: 7229L, N7229L, N-7229L, Serial Number: 307, Year manufactured: 1997, Airworthiness Date: 06/15/1997, Certificate Issue Date: 08/30/2017 Registrant (Individual): Zane M Salber, 213 E Baker St, Minneola, FL 34715 Deregistered:Cancel Date: 12/08/2020
Aircraft: YOWELL THOMAS A MALLARD II (Category: Amphibian, Seats: 2, Weight: Up to 12,499 Pounds), Engine: ROTAX 912S (100 HP) (4 Cycle) N-Number: 463AT, N463AT, N-463AT, Serial Number: 2M002, Year manufactured: 1996, Airworthiness Date: 09/17/2007, Certificate Issue Date: 08/16/2007 Registrant (Individual): Thomas A Yowell, 569 Summerwood Dr, Minneola, FL 34715 Deregistered:Cancel Date: 07/06/2017
Home Mortgage Disclosure Act Aggregated Statistics For Year 2009 (Based on 1 partial tract)
A) FHA, FSA/RHS & VA Home Purchase Loans
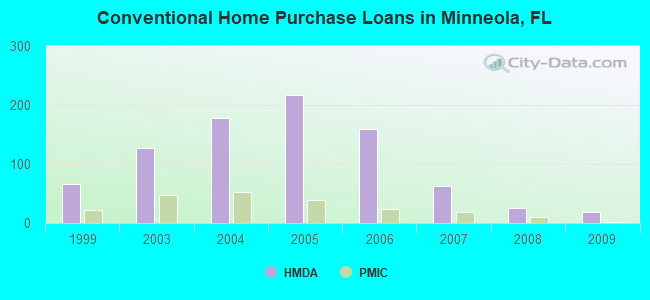
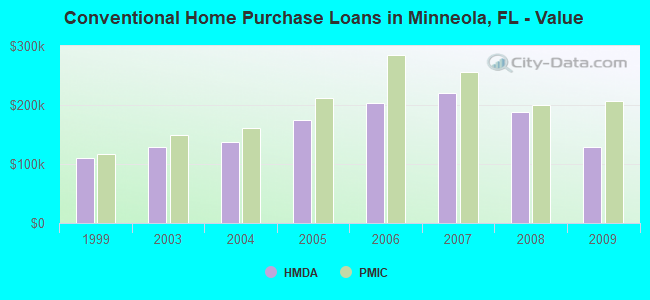
B) Conventional Home Purchase Loans
C) Refinancings
D) Home Improvement Loans
F) Non-occupant Loans on < 5 Family Dwellings (A B C & D)
G) Loans On Manufactured Home Dwelling (A B C & D)
Number
Average Value
Number
Average Value
Number
Average Value
Number
Average Value
Number
Average Value
Number
Average Value
LOANS ORIGINATED
38
$156,295
19
$128,273
32
$154,844
1
$132,680
7
$117,251
0
$0
APPLICATIONS APPROVED, NOT ACCEPTED
2
$159,190
2
$124,645
5
$185,330
0
$0
1
$160,460
0
$0
APPLICATIONS DENIED
10
$154,240
6
$127,558
29
$188,930
2
$83,330
4
$128,310
1
$95,460
APPLICATIONS WITHDRAWN
5
$128,620
3
$117,733
15
$165,750
0
$0
2
$121,470
0
$0
FILES CLOSED FOR INCOMPLETENESS
1
$114,910
1
$75,720
3
$142,457
0
$0
0
$0
0
$0
Aggregated Statistics For Year 2008 (Based on 1 partial tract)
A) FHA, FSA/RHS & VA Home Purchase Loans
B) Conventional Home Purchase Loans
C) Refinancings
D) Home Improvement Loans
F) Non-occupant Loans on < 5 Family Dwellings (A B C & D)
G) Loans On Manufactured Home Dwelling (A B C & D)
Number
Average Value
Number
Average Value
Number
Average Value
Number
Average Value
Number
Average Value
Number
Average Value
LOANS ORIGINATED
25
$200,891
25
$188,698
32
$183,009
2
$60,420
10
$183,638
0
$0
APPLICATIONS APPROVED, NOT ACCEPTED
2
$132,540
4
$141,282
10
$184,090
1
$70,080
2
$201,910
1
$53,160
APPLICATIONS DENIED
8
$212,945
11
$193,208
40
$209,219
6
$100,603
6
$218,692
1
$84,600
APPLICATIONS WITHDRAWN
3
$142,363
4
$193,805
14
$204,379
0
$0
3
$158,107
0
$0
FILES CLOSED FOR INCOMPLETENESS
1
$266,210
1
$227,150
4
$203,322
0
$0
1
$225,180
0
$0
Aggregated Statistics For Year 2007 (Based on 1 partial tract)
A) FHA, FSA/RHS & VA Home Purchase Loans
B) Conventional Home Purchase Loans
C) Refinancings
D) Home Improvement Loans
F) Non-occupant Loans on < 5 Family Dwellings (A B C & D)
G) Loans On Manufactured Home Dwelling (A B C & D)
Number
Average Value
Number
Average Value
Number
Average Value
Number
Average Value
Number
Average Value
Number
Average Value
LOANS ORIGINATED
4
$227,855
62
$220,690
99
$188,165
14
$95,759
22
$214,852
1
$190,350
APPLICATIONS APPROVED, NOT ACCEPTED
0
$0
8
$224,225
21
$194,721
5
$89,394
4
$222,602
0
$0
APPLICATIONS DENIED
1
$211,220
20
$230,796
87
$216,070
17
$69,215
17
$231,323
1
$117,170
APPLICATIONS WITHDRAWN
0
$0
10
$215,716
36
$204,462
3
$104,903
4
$238,608
0
$0
FILES CLOSED FOR INCOMPLETENESS
0
$0
3
$245,857
11
$248,814
0
$0
2
$279,605
0
$0
Aggregated Statistics For Year 2006 (Based on 1 partial tract)
A) FHA, FSA/RHS & VA Home Purchase Loans
B) Conventional Home Purchase Loans
C) Refinancings
D) Home Improvement Loans
F) Non-occupant Loans on < 5 Family Dwellings (A B C & D)
G) Loans On Manufactured Home Dwelling (A B C & D)
Number
Average Value
Number
Average Value
Number
Average Value
Number
Average Value
Number
Average Value
Number
Average Value
LOANS ORIGINATED
3
$194,157
159
$202,570
149
$187,113
18
$111,688
52
$210,692
2
$73,180
APPLICATIONS APPROVED, NOT ACCEPTED
0
$0
22
$200,592
30
$189,748
4
$63,978
7
$239,459
1
$103,920
APPLICATIONS DENIED
0
$0
42
$209,133
74
$196,735
16
$95,581
19
$206,869
3
$61,053
APPLICATIONS WITHDRAWN
1
$113,930
21
$224,633
58
$192,110
5
$126,082
9
$216,780
0
$0
FILES CLOSED FOR INCOMPLETENESS
0
$0
5
$243,310
13
$212,346
0
$0
2
$280,450
0
$0
Aggregated Statistics For Year 2005 (Based on 1 partial tract)
A) FHA, FSA/RHS & VA Home Purchase Loans
B) Conventional Home Purchase Loans
C) Refinancings
D) Home Improvement Loans
F) Non-occupant Loans on < 5 Family Dwellings (A B C & D)
G) Loans On Manufactured Home Dwelling (A B C & D)
Number
Average Value
Number
Average Value
Number
Average Value
Number
Average Value
Number
Average Value
Number
Average Value
LOANS ORIGINATED
6
$161,468
217
$173,880
186
$169,026
24
$100,745
84
$177,405
3
$71,533
APPLICATIONS APPROVED, NOT ACCEPTED
0
$0
23
$167,103
33
$166,072
5
$76,224
8
$184,199
1
$41,450
APPLICATIONS DENIED
1
$82,770
39
$174,500
76
$172,319
19
$81,335
18
$182,618
3
$69,653
APPLICATIONS WITHDRAWN
1
$100,390
35
$173,986
70
$172,977
9
$146,546
12
$177,037
1
$60,770
FILES CLOSED FOR INCOMPLETENESS
0
$0
6
$179,540
16
$172,575
1
$93,340
3
$160,553
0
$0
Aggregated Statistics For Year 2004 (Based on 1 partial tract)
A) FHA, FSA/RHS & VA Home Purchase Loans
B) Conventional Home Purchase Loans
C) Refinancings
D) Home Improvement Loans
F) Non-occupant Loans on < 5 Family Dwellings (A B C & D)
G) Loans On Manufactured Home Dwelling (A B C & D)
Number
Average Value
Number
Average Value
Number
Average Value
Number
Average Value
Number
Average Value
Number
Average Value
LOANS ORIGINATED
16
$151,566
178
$137,792
102
$128,528
11
$52,183
50
$137,388
3
$70,217
APPLICATIONS APPROVED, NOT ACCEPTED
1
$113,510
18
$141,533
23
$134,680
3
$38,633
5
$145,682
1
$43,150
APPLICATIONS DENIED
3
$147,063
29
$138,092
62
$133,049
15
$48,485
7
$133,266
2
$61,405
APPLICATIONS WITHDRAWN
2
$132,115
25
$144,130
51
$136,817
4
$64,790
8
$146,886
1
$63,590
FILES CLOSED FOR INCOMPLETENESS
1
$130,140
6
$157,050
11
$137,373
1
$45,120
2
$169,480
0
$0
Aggregated Statistics For Year 2003 (Based on 1 partial tract)
A) FHA, FSA/RHS & VA Home Purchase Loans
B) Conventional Home Purchase Loans
C) Refinancings
D) Home Improvement Loans
F) Non-occupant Loans on < 5 Family Dwellings (A B C & D)
Number
Average Value
Number
Average Value
Number
Average Value
Number
Average Value
Number
Average Value
LOANS ORIGINATED
22
$136,462
127
$129,620
177
$117,807
7
$31,684
35
$118,130
APPLICATIONS APPROVED, NOT ACCEPTED
1
$116,320
13
$116,758
28
$121,129
2
$31,865
4
$115,655
APPLICATIONS DENIED
4
$124,785
16
$112,333
58
$116,031
8
$31,936
3
$120,083
APPLICATIONS WITHDRAWN
2
$115,410
16
$130,425
47
$118,854
1
$43,290
4
$117,312
FILES CLOSED FOR INCOMPLETENESS
1
$86,150
6
$141,635
10
$131,694
1
$27,070
1
$202,050
Aggregated Statistics For Year 1999 (Based on 1 partial tract)
A) FHA, FSA/RHS & VA Home Purchase Loans
B) Conventional Home Purchase Loans
C) Refinancings
D) Home Improvement Loans
F) Non-occupant Loans on < 5 Family Dwellings (A B C & D)
Detailed PMIC statistics for the following Tracts:0313.04
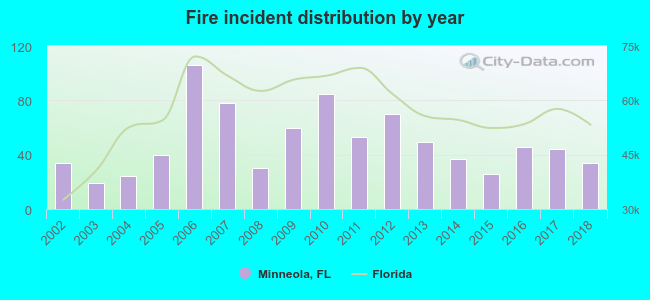
2002 - 2018 National Fire Incident Reporting System (NFIRS) incidents
According to the data from the years 2002 - 2018 the average number of fires per year is 49. The highest number of fire incidents - 106 took place in 2006, and the least - 19 in 2003. The data has a constant trend.
When looking into fire subcategories, the most reports belonged to: Outside Fires (45.9%), and Structure Fires (30.9%).
Fire incident types reported to NFIRS in Minneola, FL
#36 on the list of "Top 101 cities with the most residents born in Guyana (population 500+)"
#42 on the list of "Top 101 cities with the most people taking a motorcycle to work (population 5,000+)"
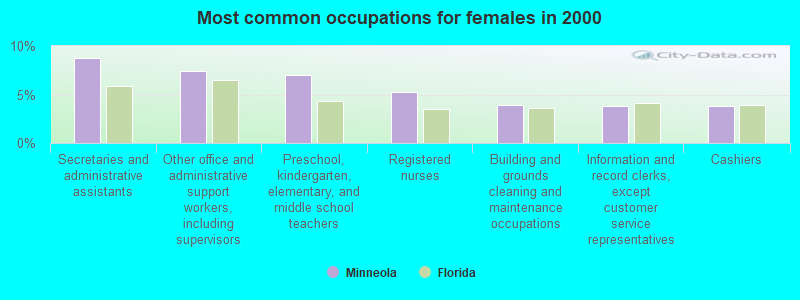
#52 on the list of "Top 101 cities with largest percentage of females in industries: administrative and support and waste management services (population 5,000+)"
#52 on the list of "Top 101 cities with the most residents born in Trinidad and Tobago (population 500+)"
#60 on the list of "Top 101 cities with the most residents born in Jamaica (population 500+)"
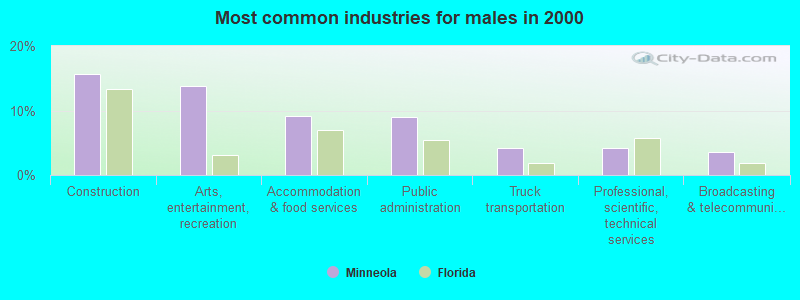
#80 on the list of "Top 100 cities with strongest arts, entertainment, recreation, accommodation and food services industries (pop. 5,000+)"
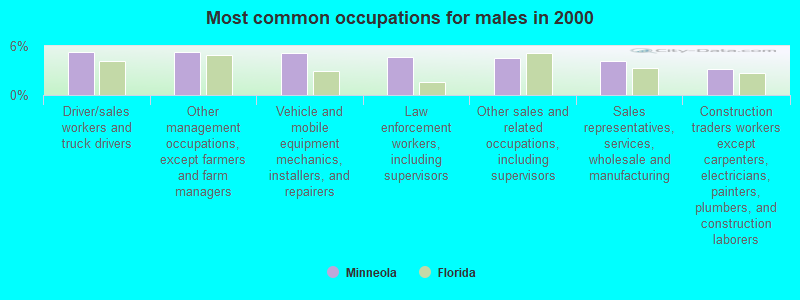
#97 on the list of "Top 101 cities with largest percentage of males in occupations: fire fighting and prevention workers including supervisors (population 5,000+)"
#22 on the list of "Top 101 counties with the largest number of people without health insurance coverage in 2000 (pop. 50,000+)"
#55 on the list of "Top 101 counties with the largest decrease in the number of deaths per 1000 residents 2000-2006 to 2007-2013 (pop. 50,000+)"
#59 on the list of "Top 101 counties with the highest ground withdrawal of fresh water for public supply"
#71 on the list of "Top 101 counties with the largest number of people moving in compared to moving out (pop. 50,000+)"
#90 on the list of "Top 101 counties with the lowest number of births per 1000 residents 2007-2013"


 Recent articles from our blog. Our writers, many of them Ph.D. graduates or candidates, create easy-to-read articles on a wide variety of topics.

 , pop. 105,946).

 According to the data from the years 2002 - 2018 the average number of fires per year is 49. The highest number of fire incidents - 106 took place in 2006, and the least - 19 in 2003. The data has a constant trend.
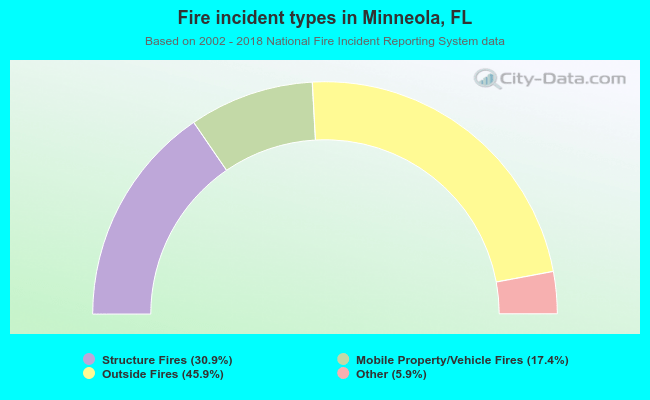 When looking into fire subcategories, the most reports belonged to: Outside Fires (45.9%), and Structure Fires (30.9%).