Sterling: Fire Incidents, Massachusetts (MA)
Where are fire incidents reported in Sterling, MA
Something went wrong! Please refresh the page.
| Fire incidents reported | |
|---|---|
| Sreet name | Count |
| INTERSTATE 190 | 124 |
| LEOMINSTER RD | 52 |
| REDEMPTION ROCK TRL | 46 |
| CHACE HILL RD | 34 |
| CLINTON RD | 34 |
| PRINCETON RD | 32 |
| WORCESTER RD | 30 |
| NEWELL HILL RD | 26 |
| UPPER NORTH ROW RD | 26 |
| HEYWOOD RD | 24 |
| MAIN ST | 24 |
| OSGOOD RD | 22 |
| PRATTS JUNCTION RD | 22 |
| ALBRIGHT RD | 20 |
| DANA HILL RD | 20 |
| MEETINGHOUSE HILL RD | 20 |
| BEAMAN RD | 18 |
| REDSTONE HILL RD | 18 |
| SPRATT TECHNOLOGY WAY | 18 |
| KENDALL HILL RD | 16 |
| NORTH ROW RD | 16 |
| ROWLEY HILL RD | 16 |
| WAUSHACUM AVE | 16 |
| BEAN RD | 14 |
| BIRD ST | 14 |
| GATES RD | 14 |
| HOLDEN RD | 14 |
| BIRCH DR | 12 |
| GREENLAND RD | 12 |
| JAMES RD | 12 |
2002 - 2018 National Fire Incident Reporting System (NFIRS) incidents
- Incident types reported to NFIRS in Sterling, MA
- 2,39247.7%Rescue & EMS
- 73214.6%Service Call
- 64912.9%Fire
- 4959.9%Hazardous Condition
- 4839.6%False Alarm
- 2505.0%Good Intent Call
- 80.2%Severe Weather
- Fire incident types reported to NFIRS in Sterling, MA
- 26440.7%Structure Fires
- 21433.0%Outside Fires
- 11217.3%Mobile Property/Vehicle Fires
- 599.1%Other
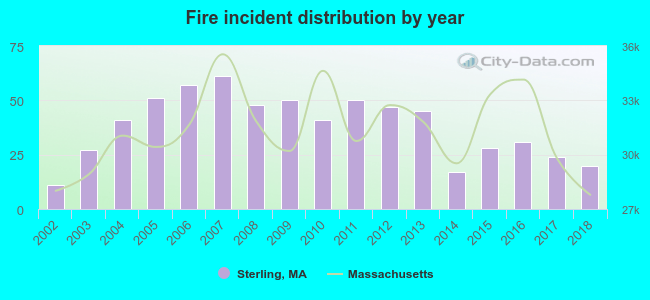 Based on the data from the years 2002 - 2018 the average number of fires per year is 38. The highest number of fires - 61 took place in 2007, and the least - 11 in 2002. The data has an increasing trend.
The average number of yearly fire incidents per 10k residents in Sterling, MA compared to nearest cities:
(Note: Based on data for the last 3 years, including only cities with population 5,000 and above)
| Sterling: | 32.0 |
| Clinton: | 88.9 |
| West Boylston: | 39.6 |
| Lancaster: | 34.3 |
| Leominster: | 62.0 |
| Holden: | 19.8 |
| Fitchburg: | 120.3 |
| Westminster: | 49.9 |
| Harvard: | 36.3 |
 The median response time based on all reported fire incidents is 6 minutes. This is higher compared to the Massachusetts median value.
The median response time in Sterling, MA compared to nearest cities:
(Note: Based on data for all years, including only cities with at least 500 fire incidents)
| Sterling: | 6 minutes |
| Clinton: | 3 minutes |
| Leominster: | 4 minutes |
| Holden: | 6 minutes |
| Fitchburg: | 4 minutes |
| Westminster: | 6 minutes |
| Harvard: | 9 minutes |
| Shrewsbury: | 4 minutes |
| Northborough: | 6 minutes |
 Based on the data from the years 2002 - 2018 the average number of fire-related yearly casualties is 0. The highest number of reported casualties - 2 took place in 2005, and the lowest - 0 in 2002. The data has a constant trend.
The average number of injuries per 1,000 fire incidents is 6. This indicator was the highest - 39 in 2005, and the lowest 0 in 2002. The trend for injuries per 1,000 incidents is constant. Compared to the Massachusetts value the number of injuries per 1,000 fire incidents is lower.
Based on the data from the years 2002 - 2018 the average number of fire-related yearly casualties is 0. The highest number of reported casualties - 2 took place in 2005, and the lowest - 0 in 2002. The data has a constant trend.
The average number of injuries per 1,000 fire incidents is 6. This indicator was the highest - 39 in 2005, and the lowest 0 in 2002. The trend for injuries per 1,000 incidents is constant. Compared to the Massachusetts value the number of injuries per 1,000 fire incidents is lower.Casualties per 1,000 incidents in Sterling, MA compared to nearest cities:
(Note: Based on data for all years, including only cities with at least 500 fire incidents)
| Sterling: | 7.7 |
| Clinton: | 5.5 |
| Leominster: | 10.6 |
| Holden: | 15.1 |
| Fitchburg: | 15.4 |
| Westminster: | 10.7 |
| Harvard: | 2.0 |
| Shrewsbury: | 3.4 |
| Northborough: | 18.2 |
 31.7% incidents where reported in the morning and 68.3% in the evening. The most fires (16.8%) took place on Saturday, and the least (12.8%) on Friday.
 According to the 649 incident reports from years 2002 - 2018 most fires (18.2%) took place during April, and the least (4.9%) in October.
 Out of all 5,014 cases reported during the years 2002 - 2018, the most belonged to the categories: Rescue & EMS (47.7%), Service Call (14.6%), and Fire (12.9%).
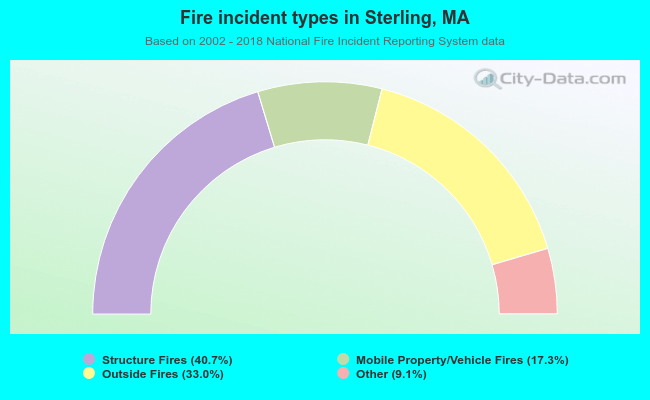 When looking into fire subcategories, the most reports belonged to: Structure Fires (40.7%), and Outside Fires (33.0%).