Fitchburg: Fire Incidents, Massachusetts (MA)
Where are fire incidents reported in Fitchburg, MA
Something went wrong! Please refresh the page.
| Fire incidents reported | |
|---|---|
| Sreet name | Count |
| DAY ST | 552 |
| MAIN ST | 420 |
| GREAT WOLF DR | 400 |
| HIGHLAND AVE | 372 |
| DANIELS ST | 364 |
| WATER ST | 350 |
| NORTH ST | 280 |
| WALLACE AVE | 250 |
| COLUMBUS ST | 240 |
| JOHN FITCH HWY | 236 |
| CEDAR ST | 210 |
| LUNENBURG ST | 200 |
| SUMMER ST | 196 |
| BLOSSOM ST | 190 |
| MECHANIC ST | 174 |
| SOUTH ST | 172 |
| WESTMINSTER HL RD | 172 |
| MYRTLE AVE | 156 |
| RIVER ST | 140 |
| ELM ST | 130 |
| HIGH ST | 114 |
| PLEASANT ST | 114 |
| PRICHARD ST | 102 |
| FRANKLIN RD | 96 |
| KIMBALL ST | 96 |
| ELECTRIC AVE | 88 |
| ROLLSTONE ST | 88 |
| WESTMINSTER ST | 86 |
| BEECH ST | 80 |
| PRATT RD | 80 |
| Other | 75 |
2002 - 2018 National Fire Incident Reporting System (NFIRS) incidents
- Incident types reported to NFIRS in Fitchburg, MA
- 13,33836.3%Rescue & EMS
- 6,22316.9%Fire
- 5,82615.8%False Alarm
- 4,42512.0%Hazardous Condition
- 4,08911.1%Service Call
- 2,7547.5%Good Intent Call
- 700.2%Special Incident
- Fire incident types reported to NFIRS in Fitchburg, MA
- 4,48272.0%Structure Fires
- 1,22319.7%Outside Fires
- 4377.0%Mobile Property/Vehicle Fires
- 811.3%Other
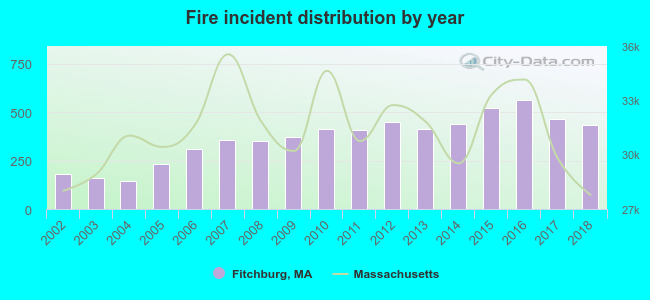 According to the data from the years 2002 - 2018 the average number of fire incidents per year is 366. The highest number of fire incidents - 562 took place in 2016, and the least - 146 in 2004. The data has a growing trend.
The average number of yearly fire incidents per 10k residents in Fitchburg, MA compared to nearest cities:
(Note: Based on data for the last 3 years, including only cities with population 5,000 and above)
| Fitchburg: | 120.3 |
| Leominster: | 62.0 |
| Westminster: | 49.9 |
| Ashburnham: | 32.3 |
| Gardner: | 93.2 |
| Lancaster: | 34.3 |
| Sterling: | 32.0 |
| Harvard: | 36.3 |
| Clinton: | 88.9 |
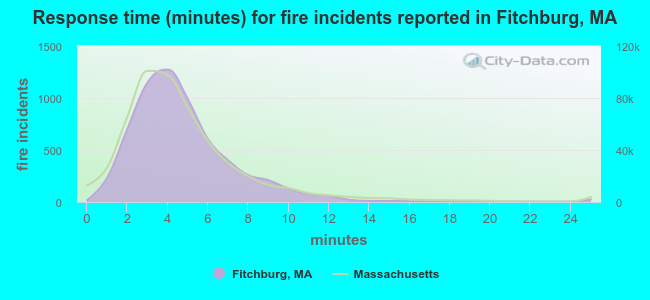 The median response time based on all reported fire incidents is 4 minutes. This is about the same as the Massachusetts median value.
The median response time in Fitchburg, MA compared to nearest cities:
(Note: Based on data for all years, including only cities with at least 500 fire incidents)
| Fitchburg: | 4 minutes |
| Lunenburg: | 6 minutes |
| Leominster: | 4 minutes |
| Westminster: | 6 minutes |
| Gardner: | 4 minutes |
| Sterling: | 6 minutes |
| Ayer: | 4 minutes |
| Harvard: | 9 minutes |
| Clinton: | 3 minutes |
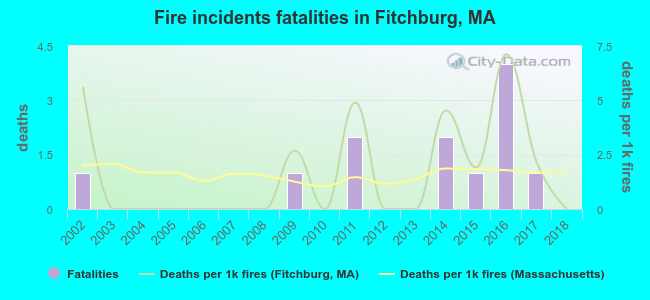 Based on the reports from the years 2002 - 2018 the average number of fire-related fatalities per year is 1. The highest number of reported deaths - 4 took place in 2016, and the lowest - 0 in 2003. The data has a declining trend.
The average number of deaths per 1,000 fire incidents is 2. This indicator was the highest - 7 in 2016, and the lowest 0 in 2003. The trend for fatalities per 1,000 incidents is decreasing. Compared to the Massachusetts value the number of deaths per 1,000 incidents is higher.
Based on the reports from the years 2002 - 2018 the average number of fire-related fatalities per year is 1. The highest number of reported deaths - 4 took place in 2016, and the lowest - 0 in 2003. The data has a declining trend.
The average number of deaths per 1,000 fire incidents is 2. This indicator was the highest - 7 in 2016, and the lowest 0 in 2003. The trend for fatalities per 1,000 incidents is decreasing. Compared to the Massachusetts value the number of deaths per 1,000 incidents is higher.Deaths per 1,000 incidents in Fitchburg, MA compared to nearest cities:
(Note: Based on data for all years, including only cities with at least 2,500 fire incidents)
| Fitchburg: | 1.9 |
| Leominster: | 1.3 |
| Worcester: | 0.8 |
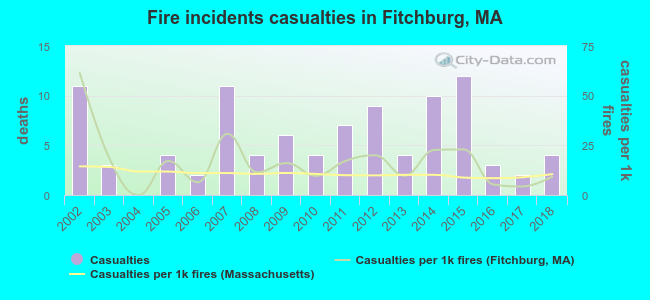 According to the data from the years 2002 - 2018 the average number of fire-related casualties per year is 6. The highest number of injuries - 12 took place in 2015, and the lowest - 0 in 2004. The data has a decreasing trend.
The average number of injuries per 1,000 fire incidents is 17. This indicator was the highest - 61 in 2002, and the lowest 0 in 2004. The trend for casualties per 1,000 incidents is decreasing. Compared to the Massachusetts value the number of casualties per 1,000 fire incidents is higher.
According to the data from the years 2002 - 2018 the average number of fire-related casualties per year is 6. The highest number of injuries - 12 took place in 2015, and the lowest - 0 in 2004. The data has a decreasing trend.
The average number of injuries per 1,000 fire incidents is 17. This indicator was the highest - 61 in 2002, and the lowest 0 in 2004. The trend for casualties per 1,000 incidents is decreasing. Compared to the Massachusetts value the number of casualties per 1,000 fire incidents is higher.Casualties per 1,000 incidents in Fitchburg, MA compared to nearest cities:
(Note: Based on data for all years, including only cities with at least 500 fire incidents)
| Fitchburg: | 15.4 |
| Lunenburg: | 15.4 |
| Leominster: | 10.6 |
| Westminster: | 10.7 |
| Gardner: | 9.0 |
| Sterling: | 7.7 |
| Ayer: | 8.5 |
| Harvard: | 2.0 |
| Clinton: | 5.5 |
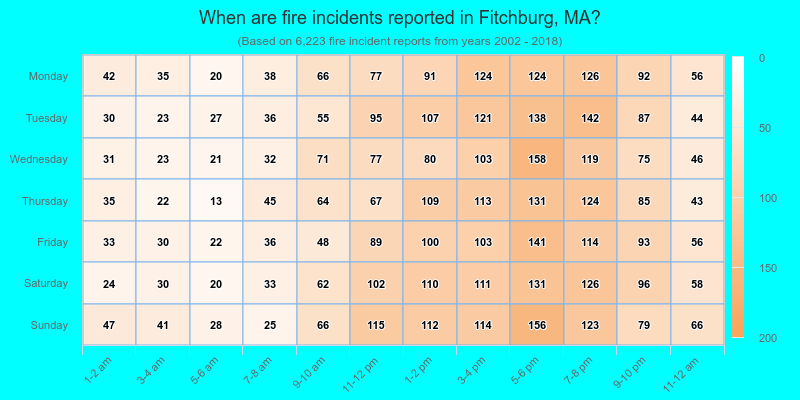
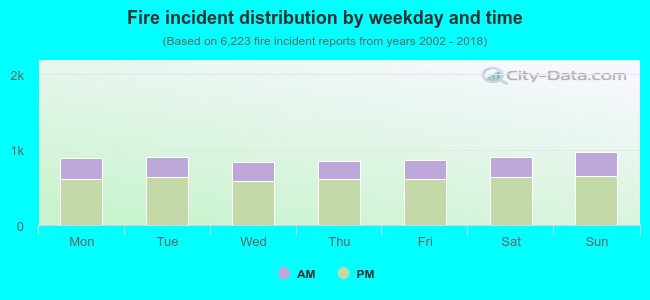 30.5% incidents where reported in the morning and 69.5% in the evening. The most fires (15.6%) took place on Sunday, and the least (13.4%) on Wednesday.
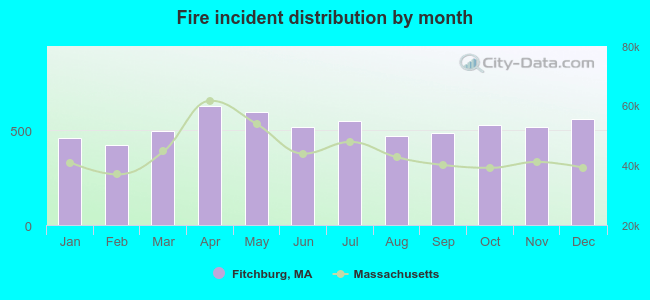 According to the 6,223 incident reports from years 2002 - 2018 most fires (10.1%) took place during April, and the least (6.7%) in February.
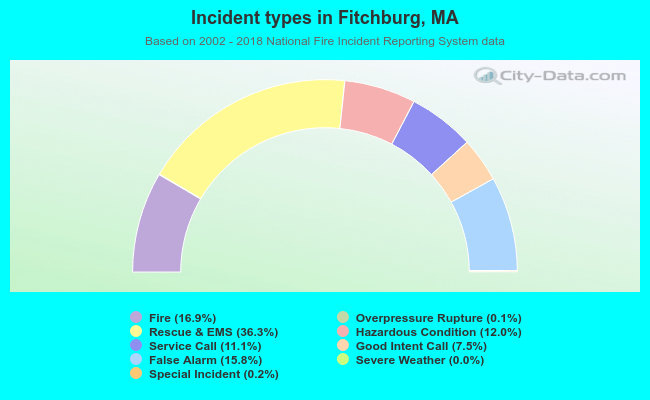 Out of all 36,762 cases reported during the years 2002 - 2018, the most belonged to the categories: Rescue & EMS (36.3%), Fire (16.9%), and False Alarm (15.8%).
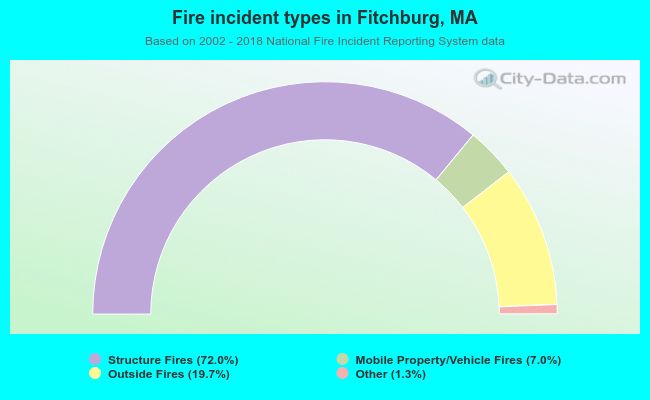 When looking into fire subcategories, the most incidents belonged to: Structure Fires (72.0%), and Outside Fires (19.7%).