Ashburnham: Fire Incidents, Massachusetts (MA)
Where are fire incidents reported in Ashburnham, MA
Something went wrong! Please refresh the page.
|
| |||||||||||||||||||||||||||||||||||||||||||||||||||||||||||||||||||||||||||||||||||||||||||||||||||||||||||||
2002 - 2018 National Fire Incident Reporting System (NFIRS) incidents
- Incident types reported to NFIRS in Ashburnham, MA
- 92541.1%Rescue & EMS
- 39917.7%False Alarm
- 32214.3%Fire
- 28412.6%Service Call
- 1858.2%Hazardous Condition
- 1255.6%Good Intent Call
- 60.3%Special Incident
- 40.2%Severe Weather
- Fire incident types reported to NFIRS in Ashburnham, MA
- 17052.8%Structure Fires
- 11134.5%Outside Fires
- 288.7%Mobile Property/Vehicle Fires
- 134.0%Other
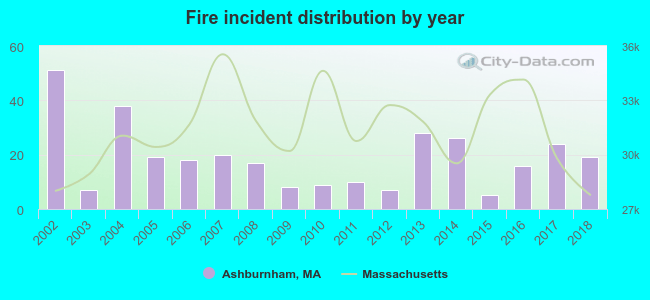 According to the data from the years 2002 - 2018 the average number of fire incidents per year is 19. The highest number of reported fire incidents - 51 took place in 2002, and the least - 5 in 2015. The data has a decreasing trend.
The average number of yearly fire incidents per 10k residents in Ashburnham, MA compared to nearest cities:
(Note: Based on data for the last 3 years, including only cities with population 5,000 and above)
| Ashburnham: | 32.3 |
| Gardner: | 93.2 |
| Westminster: | 49.9 |
| Fitchburg: | 120.3 |
| Templeton: | 10.0 |
| Leominster: | 62.0 |
| Athol: | 76.2 |
| Sterling: | 32.0 |
| Lancaster: | 34.3 |

 32.3% incidents where reported in the morning and 67.7% in the evening. The most fires (17.4%) took place on Tuesday, and the least (10.2%) on Thursday.
 According to the 322 fire incident reports from years 2002 - 2018 most fires (18.0%) took place during April, and the least (2.8%) in September.
 Out of all 2,250 cases reported during the years 2002 - 2018, the most belonged to the categories: Overpressure Rupture (41.1%), Good Intent Call (17.7%), and Fire (14.3%).
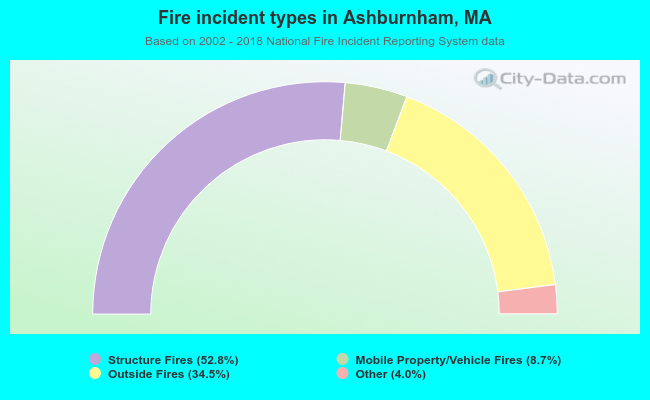 When looking into fire subcategories, the most reports belonged to: Structure Fires (52.8%), and Outside Fires (34.5%).