Gardner: Fire Incidents, Massachusetts (MA)
Where are fire incidents reported in Gardner, MA
Something went wrong! Please refresh the page.
| Fire incidents reported | |
|---|---|
| Sreet name | Count |
| MAIN ST | 120 |
| PLEASANT ST | 114 |
| NICHOLS ST | 78 |
| WEST BROADWAY | 74 |
| BAKER ST | 68 |
| MAIN ST. | 68 |
| PEARL ST | 68 |
| HEMLOCK DR | 64 |
| CHURCH ST | 60 |
| PLEASANT ST. | 58 |
| SOUTH MAIN ST | 56 |
| PEARSON BL | 48 |
| SCHOOL ST | 46 |
| WEST ST. | 46 |
| PARKER ST | 44 |
| PEARSON BL. | 44 |
| TIMPANY BL | 44 |
| GREEN ST | 42 |
| CENTRAL ST | 40 |
| CROSS ST | 40 |
| GRAHAM ST | 40 |
| TIMPANY BL. | 40 |
| CLARK ST | 38 |
| GREENWOOD ST. | 36 |
| MANCA DR | 36 |
| PARK ST | 36 |
| PINE ST | 36 |
| RIDGEWOOD LN | 36 |
| PARK ST. | 32 |
| BLANCHARD ST | 30 |
| Other | 423 |
2002 - 2018 National Fire Incident Reporting System (NFIRS) incidents
- Incident types reported to NFIRS in Gardner, MA
- 16,04653.6%Rescue & EMS
- 3,30511.0%Service Call
- 2,7289.1%False Alarm
- 2,3757.9%Special Incident
- 2,3217.8%Hazardous Condition
- 2,0056.7%Fire
- 1,1183.7%Good Intent Call
- Fire incident types reported to NFIRS in Gardner, MA
- 1,27563.6%Structure Fires
- 43921.9%Outside Fires
- 1909.5%Mobile Property/Vehicle Fires
- 1015.0%Other
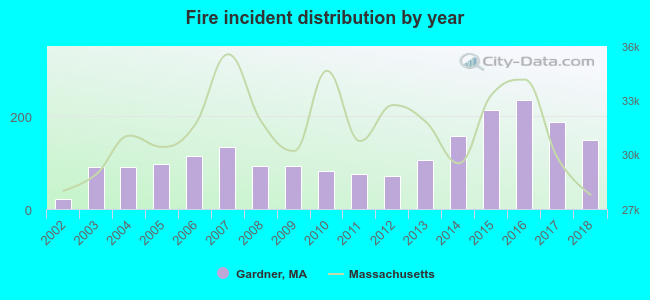 According to the data from the years 2002 - 2018 the average number of fire incidents per year is 118. The highest number of reported fire incidents - 234 took place in 2016, and the least - 22 in 2002. The data has a growing trend.
The average number of yearly fire incidents per 10k residents in Gardner, MA compared to nearest cities:
(Note: Based on data for the last 3 years, including only cities with population 5,000 and above)
| Gardner: | 93.2 |
| Templeton: | 10.0 |
| Westminster: | 49.9 |
| Ashburnham: | 32.3 |
| Fitchburg: | 120.3 |
| Athol: | 76.2 |
| Leominster: | 62.0 |
| Sterling: | 32.0 |
| Holden: | 19.8 |
 The median response time based on all reported fire incidents is 4 minutes. This is comparable to the state median value.
The median response time in Gardner, MA compared to nearest cities:
(Note: Based on data for all years, including only cities with at least 500 fire incidents)
| Gardner: | 4 minutes |
| Westminster: | 6 minutes |
| Winchendon: | 5 minutes |
| Fitchburg: | 4 minutes |
| Athol: | 5 minutes |
| Leominster: | 4 minutes |
| Lunenburg: | 6 minutes |
| Sterling: | 6 minutes |
| Orange: | 7 minutes |
 According to the reports from the years 2002 - 2018 the average number of fire-related yearly deaths is 0. The highest number of deaths - 1 took place in 2012, and the lowest - 0 in 2002. The data has a constant trend.
 According to the reports from the years 2002 - 2018 the average number of fire-related yearly casualties is 1. The highest number of reported casualties - 3 took place in 2015, and the lowest - 0 in 2002. The data has a constant trend.
The average number of injuries per 1,000 fire incidents is 9. This indicator was the highest - 22 in 2008, and the lowest 0 in 2002. The trend for casualties per 1,000 incidents is constant. Compared to the state value the number of injuries per 1,000 fire incidents is similar.
According to the reports from the years 2002 - 2018 the average number of fire-related yearly casualties is 1. The highest number of reported casualties - 3 took place in 2015, and the lowest - 0 in 2002. The data has a constant trend.
The average number of injuries per 1,000 fire incidents is 9. This indicator was the highest - 22 in 2008, and the lowest 0 in 2002. The trend for casualties per 1,000 incidents is constant. Compared to the state value the number of injuries per 1,000 fire incidents is similar.Casualties per 1,000 incidents in Gardner, MA compared to nearest cities:
(Note: Based on data for all years, including only cities with at least 500 fire incidents)
| Gardner: | 9.0 |
| Westminster: | 10.7 |
| Winchendon: | 10.0 |
| Fitchburg: | 15.4 |
| Athol: | 16.3 |
| Leominster: | 10.6 |
| Lunenburg: | 15.4 |
| Sterling: | 7.7 |
| Orange: | 12.2 |
 30.1% incidents where reported in the morning and 69.9% in the evening. The most fires (15.8%) took place on Monday, and the least (12.4%) on Tuesday.
 According to the 2,005 reports from years 2002 - 2018 most fires (10.8%) took place during May, and the least (6.1%) in February.
 Out of all 29,927 cases reported during the years 2002 - 2018, the most belonged to the categories: Rescue & EMS (53.6%), Service Call (11.0%), and False Alarm (9.1%).
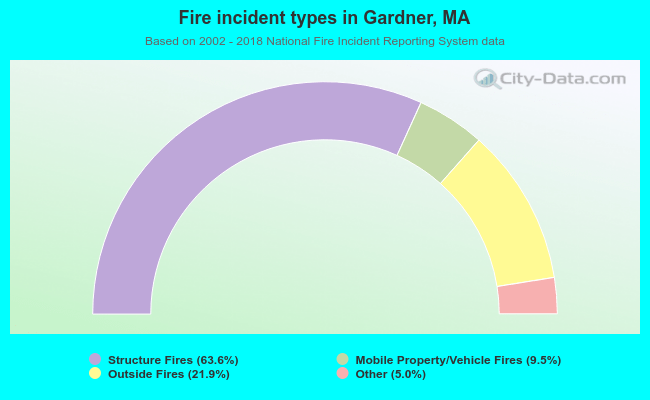 When looking into fire subcategories, the most reports belonged to: Structure Fires (63.6%), and Outside Fires (21.9%).