Clinton: Fire Incidents, Massachusetts (MA)
Where are fire incidents reported in Clinton, MA
Something went wrong! Please refresh the page.
| Fire incidents reported | |
|---|---|
| Sreet name | Count |
| LAKESIDE AVE | 310 |
| MAIN ST | 210 |
| HIGH ST | 198 |
| WATER ST | 192 |
| CHESTNUT ST | 132 |
| BERLIN ST | 112 |
| CHURCH ST | 112 |
| CAMERON ST | 88 |
| FITCH RD | 78 |
| GREEN ST | 74 |
| COOLIDGE PL | 68 |
| UNION ST | 64 |
| PLEASANT ST | 52 |
| OAK ST | 48 |
| STERLING ST | 48 |
| NATHAN DR | 44 |
| HIGHLAND ST | 32 |
| GROVE ST | 30 |
| BROOK ST | 28 |
| FULLER ST | 28 |
| EAST ST | 26 |
| WEST BOYLSTON ST | 26 |
| WHITE CT | 26 |
| WEST ST | 22 |
| ADAMS RD | 20 |
| ALLEN ST | 20 |
| DEVENWOOD WAY | 20 |
| BARRETT ST | 18 |
| BEACON ST | 18 |
| BIRCH ST | 18 |
2003 - 2018 National Fire Incident Reporting System (NFIRS) incidents
- Incident types reported to NFIRS in Clinton, MA
- 3,93747.4%Rescue & EMS
- 1,63219.6%Fire
- 1,06112.8%False Alarm
- 88110.6%Hazardous Condition
- 5356.4%Service Call
- 2422.9%Good Intent Call
- 200.2%Special Incident
- Fire incident types reported to NFIRS in Clinton, MA
- 88154.0%Structure Fires
- 36522.4%Outside Fires
- 32720.0%Other
- 593.6%Mobile Property/Vehicle Fires
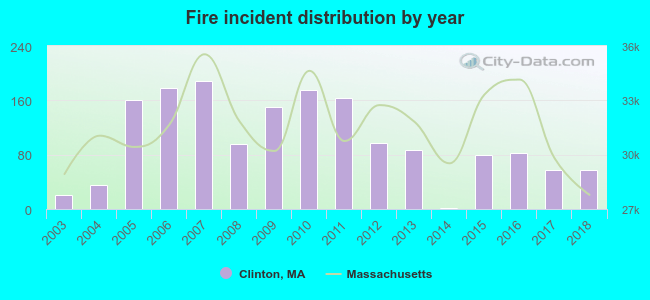 According to the data from the years 2003 - 2018 the average number of fires per year is 102. The highest number of reported fires - 188 took place in 2007, and the least - 1 in 2014. The data has a rising trend.
The average number of yearly fire incidents per 10k residents in Clinton, MA compared to nearest cities:
(Note: Based on data for the last 3 years, including only cities with population 5,000 and above)
| Clinton: | 88.9 |
| Lancaster: | 34.3 |
| Sterling: | 32.0 |
| Hudson: | 44.1 |
| West Boylston: | 39.6 |
| Northborough: | 77.8 |
| Harvard: | 36.3 |
| Leominster: | 62.0 |
| Marlborough: | 31.4 |
 The median response time based on all reported fire incidents is 3 minutes. This is lower than the state median value.
The median response time in Clinton, MA compared to nearest cities:
(Note: Based on data for all years, including only cities with at least 500 fire incidents)
| Clinton: | 3 minutes |
| Sterling: | 6 minutes |
| Hudson: | 3 minutes |
| Northborough: | 6 minutes |
| Harvard: | 9 minutes |
| Leominster: | 4 minutes |
| Marlborough: | 5 minutes |
| Shrewsbury: | 4 minutes |
| Holden: | 6 minutes |
 According to the reports from the years 2003 - 2018 the average number of fire-related yearly casualties is 1. The highest number of reported casualties - 4 took place in 2012, and the lowest - 0 in 2003. The data has a constant trend.
The average number of injuries per 1,000 fires is 4. This indicator was the highest - 41 in 2012, and the lowest 0 in 2003. The trend for injuries per 1,000 fires is constant. Compared to the Massachusetts value the number of casualties per 1,000 incidents is lower.
According to the reports from the years 2003 - 2018 the average number of fire-related yearly casualties is 1. The highest number of reported casualties - 4 took place in 2012, and the lowest - 0 in 2003. The data has a constant trend.
The average number of injuries per 1,000 fires is 4. This indicator was the highest - 41 in 2012, and the lowest 0 in 2003. The trend for injuries per 1,000 fires is constant. Compared to the Massachusetts value the number of casualties per 1,000 incidents is lower.Casualties per 1,000 incidents in Clinton, MA compared to nearest cities:
(Note: Based on data for all years, including only cities with at least 500 fire incidents)
| Clinton: | 5.5 |
| Sterling: | 7.7 |
| Hudson: | 34.8 |
| Northborough: | 18.2 |
| Harvard: | 2.0 |
| Leominster: | 10.6 |
| Marlborough: | 21.3 |
| Shrewsbury: | 3.4 |
| Holden: | 15.1 |
 31.4% incidents where reported in the morning and 68.6% in the evening. The most fires (15.6%) took place on Monday, and the least (12.1%) on Thursday.
 Based on the 1,632 fire incident reports from years 2003 - 2018 most fires (12.3%) took place during April, and the least (5.7%) in September.
 Out of all 8,312 cases reported during the years 2003 - 2018, the most belonged to the categories: Rescue & EMS (47.4%), Fire (19.6%), and False Alarm (12.8%).
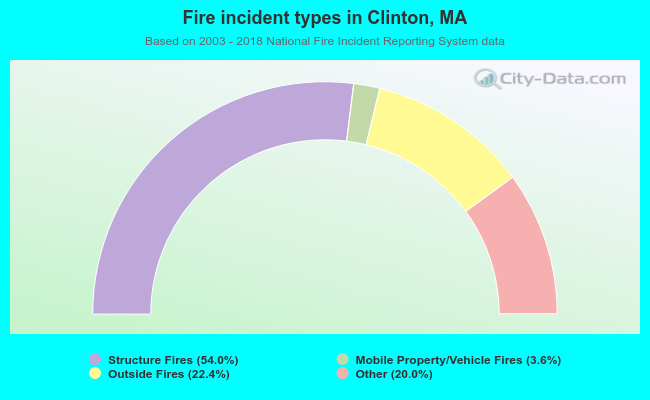 When looking into fire subcategories, the most reports belonged to: Structure Fires (54.0%), and Outside Fires (22.4%).