West Boylston: Fire Incidents, Massachusetts (MA)
Where are fire incidents reported in West Boylston, MA
Something went wrong! Please refresh the page.
|
| |||||||||||||||||||||||||||||||||||||||||||||||||||||||||||||||||||||||||||||||||||||||||||||||||||||||||||||
2002 - 2018 National Fire Incident Reporting System (NFIRS) incidents
- Incident types reported to NFIRS in West Boylston, MA
- 3,02862.6%Rescue & EMS
- 4789.9%False Alarm
- 3918.1%Fire
- 3647.5%Service Call
- 3477.2%Hazardous Condition
- 2124.4%Good Intent Call
- 100.2%Severe Weather
- 50.1%Special Incident
- Fire incident types reported to NFIRS in West Boylston, MA
- 14537.1%Structure Fires
- 14035.8%Outside Fires
- 7719.7%Mobile Property/Vehicle Fires
- 297.4%Other
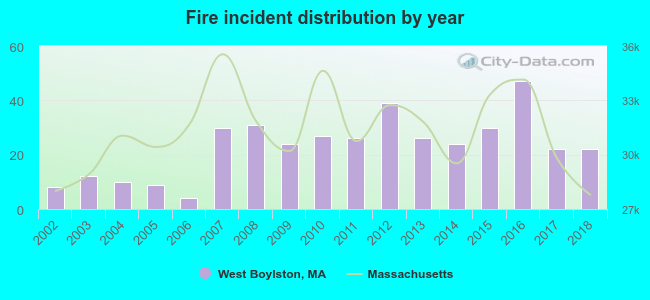 According to the data from the years 2002 - 2018 the average number of fires per year is 23. The highest number of fire incidents - 47 took place in 2016, and the least - 4 in 2006. The data has a growing trend.
The average number of yearly fire incidents per 10k residents in West Boylston, MA compared to nearest cities:
(Note: Based on data for the last 3 years, including only cities with population 5,000 and above)
| West Boylston: | 39.6 |
| Holden: | 19.8 |
| Sterling: | 32.0 |
| Shrewsbury: | 35.5 |
| Worcester: | 74.5 |
| Clinton: | 88.9 |
| Northborough: | 77.8 |
| Lancaster: | 34.3 |
| Leicester: | 33.7 |

 According to the data from the years 2002 - 2018 the average number of fire-related yearly casualties is 0. The highest number of reported injuries - 2 took place in 2017, and the lowest - 0 in 2003. The data has a constant trend.
 35.3% incidents where reported in the morning and 64.7% in the evening. The most fires (17.1%) took place on Thursday, and the least (9.2%) on Tuesday.
 Based on the 391 fire incidents from years 2002 - 2018 most fires (12.8%) took place during June, and the least (5.1%) in September.
 Out of all 4,837 cases reported during the years 2002 - 2018, the most belonged to the categories: Rescue & EMS (62.6%), False Alarm (9.9%), and Fire (8.1%).
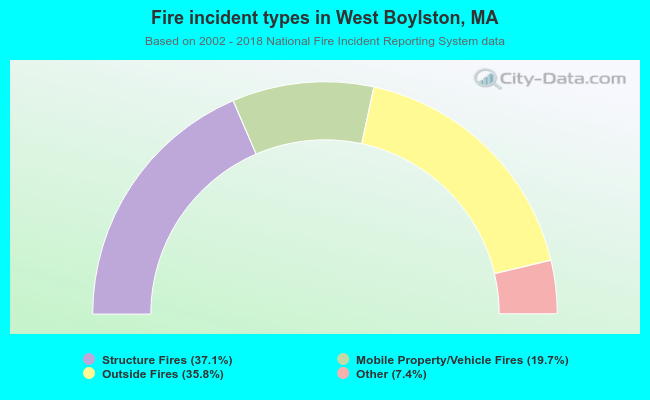 When looking into fire subcategories, the most reports belonged to: Structure Fires (37.1%), and Outside Fires (35.8%).