Plainfield: Fire Incidents, Connecticut (CT)
Where are fire incidents reported in Plainfield, CT
Something went wrong! Please refresh the page.
| Fire incidents reported | |
|---|---|
| Sreet name | Count |
| NORWICH RD | 204 |
| COMMUNITY AVE | 88 |
| LATHROP RD | 80 |
| CANTERBURY RD | 64 |
| BABCOCK AVE | 34 |
| WESTON RD | 28 |
| LOVERS LN | 26 |
| RAILROAD AVE | 26 |
| DOW RD | 24 |
| SPAULDING RD | 22 |
| PRATT RD | 20 |
| PLAINFIELD PIKE RD | 18 |
| PLEASANT ST | 18 |
| TARBOX RD | 18 |
| WINSOR AVE | 18 |
| LOWES WAY | 16 |
| HARRINGTON DR | 14 |
| KATE DOWNING RD | 14 |
| LEDGEWOOD ACRES | 14 |
| COLONIAL RD | 12 |
| PACKERVILLE RD | 12 |
| CEMETARY RD | 10 |
| LILLIBRIDGE RD | 10 |
| OAKWOOD BLVD | 10 |
| PINE ST | 10 |
| PLAINFIELD PIKE | 10 |
| ROODE RD | 10 |
| SIXTH ST | 10 |
| 6TH ST | 8 |
| 9TH ST | 8 |
2002 - 2018 National Fire Incident Reporting System (NFIRS) incidents
- Incident types reported to NFIRS in Plainfield, CT
- 3,05162.3%Rescue & EMS
- 71814.7%Fire
- 3417.0%Service Call
- 3026.2%False Alarm
- 2505.1%Hazardous Condition
- 2284.7%Good Intent Call
- 60.1%Overpressure Rupture
- Fire incident types reported to NFIRS in Plainfield, CT
- 30141.9%Structure Fires
- 25135.0%Other
- 9212.8%Outside Fires
- 7410.3%Mobile Property/Vehicle Fires
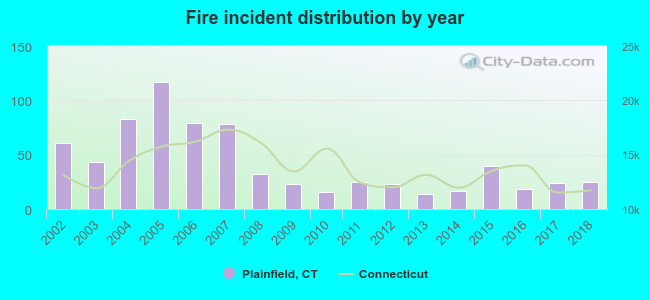 Based on the data from the years 2002 - 2018 the average number of fires per year is 42. The highest number of fires - 117 took place in 2005, and the least - 14 in 2013. The data has a dropping trend.
The average number of yearly fire incidents per 10k residents in Plainfield, CT compared to nearest cities:
(Note: Based on data for the last 3 years, including only cities with population 5,000 and above)
| Plainfield: | 14.5 |
| Canterbury: | 63.7 |
| Brooklyn: | 54.4 |
| Griswold: | 76.7 |
| Killingly: | 3.6 |
| Norwich: | 38.9 |
| Putnam: | 41.7 |
| Windham: | 5.9 |
| Willimantic: | 41.5 |
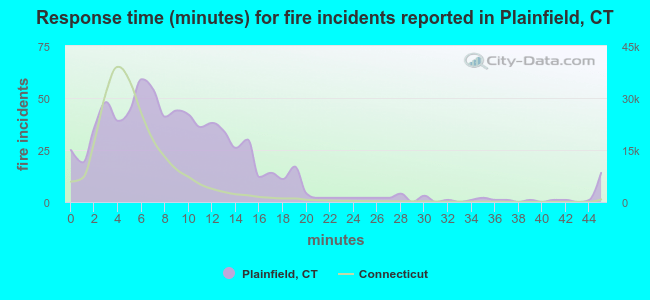 The median response time based on all reported fire incidents is 8 minutes. This is higher compared to the state median value.
The median response time in Plainfield, CT compared to nearest cities:
(Note: Based on data for all years, including only cities with at least 500 fire incidents)
| Plainfield: | 8 minutes |
| Moosup: | 8 minutes |
| Brooklyn: | 8 minutes |
| Danielson: | 9 minutes |
| Griswold: | 8 minutes |
| Preston: | 8 minutes |
| Norwich: | 4 minutes |
| Putnam: | 6 minutes |
| Willimantic: | 4 minutes |
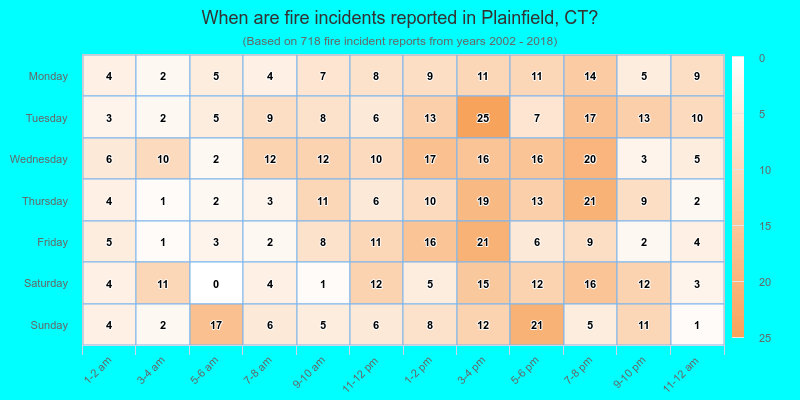
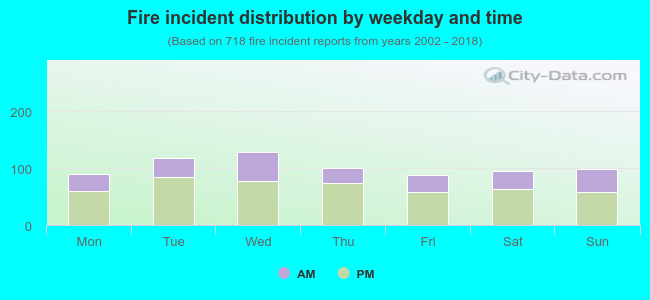 34.0% incidents where reported in the morning and 66.0% in the evening. The most fires (18.0%) took place on Wednesday, and the least (12.3%) on Friday.
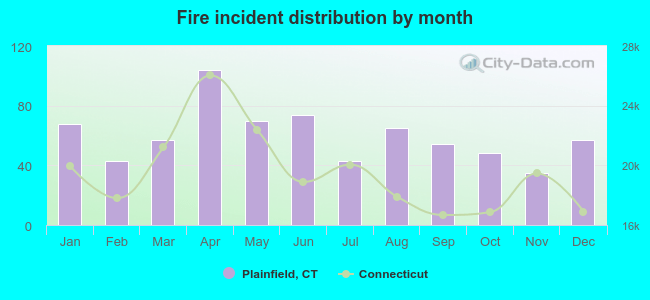 According to the 718 incident reports from years 2002 - 2018 most fires (14.5%) took place during April, and the least (4.9%) in November.
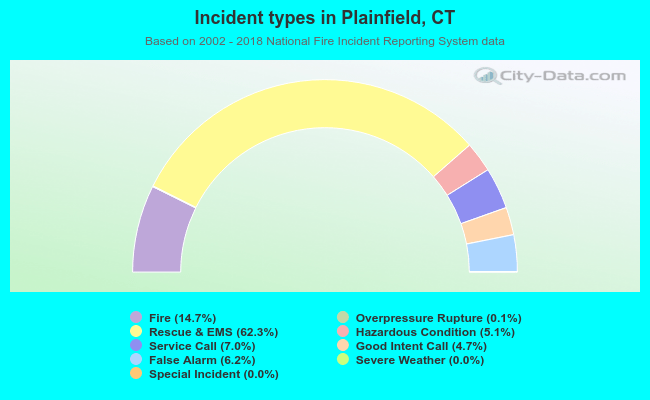 Out of all 4,898 cases reported during the years 2002 - 2018, the most belonged to the categories: Rescue & EMS (62.3%), Fire (14.7%), and Service Call (7.0%).
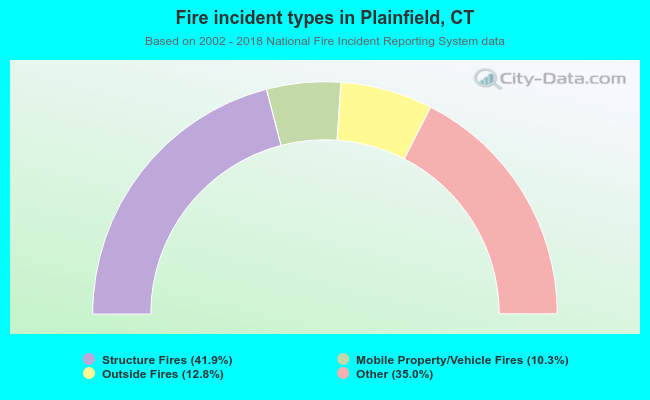 When looking into fire subcategories, the most reports belonged to: Structure Fires (41.9%), and Other (35.0%).