Norwich: Fire Incidents, Connecticut (CT)
Where are fire incidents reported in Norwich, CT
Something went wrong! Please refresh the page.
| Fire incidents reported | |
|---|---|
| Sreet name | Count |
| BROADWAY | 188 |
| WASHINGTON ST | 140 |
| NORTH MAIN ST | 136 |
| HAMILTON AVE | 132 |
| BOSWELL AVE | 126 |
| WEST MAIN ST | 108 |
| MAIN ST | 96 |
| MAIN ST | 94 |
| WEST THAMES ST | 92 |
| SALEM TPKE | 78 |
| LAUREL HILL AVE | 76 |
| PROSPECT ST | 60 |
| CEDAR ST | 58 |
| CENTRAL AVE | 58 |
| EAST MAIN ST | 54 |
| MCKINLEY AVE | 52 |
| NEW LONDON TPKE | 52 |
| CLIFF ST | 50 |
| MOHEGAN PARK RD | 46 |
| FRANKLIN ST | 44 |
| NORTH ST | 38 |
| SANDY LANE | 38 |
| BOSWELL AVE | 36 |
| ELIZABETH ST | 36 |
| THAMES ST | 36 |
| SALEM TPK | 34 |
| TAFTVILLE-OCCUM RD | 34 |
| TOWN ST | 32 |
| CHESTNUT ST | 30 |
| W THAMES ST | 30 |
| Other | 829 |
2002 - 2018 National Fire Incident Reporting System (NFIRS) incidents
- Incident types reported to NFIRS in Norwich, CT
- 11,48255.1%Rescue & EMS
- 2,91314.0%Fire
- 2,31811.1%Hazardous Condition
- 1,9429.3%False Alarm
- 1,1955.7%Service Call
- 9004.3%Good Intent Call
- 420.2%Special Incident
- 340.2%Overpressure Rupture
- 220.1%Severe Weather
- Fire incident types reported to NFIRS in Norwich, CT
- 1,48651.0%Structure Fires
- 80127.5%Outside Fires
- 48816.8%Mobile Property/Vehicle Fires
- 1384.7%Other
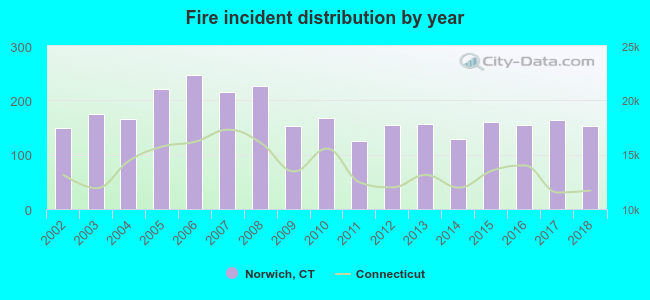 According to the data from the years 2002 - 2018 the average number of fire incidents per year is 171. The highest number of fire incidents - 246 took place in 2006, and the least - 126 in 2011. The data has a rising trend.
The average number of yearly fire incidents per 10k residents in Norwich, CT compared to nearest cities:
(Note: Based on data for the last 3 years, including only cities with population 5,000 and above)
| Norwich: | 38.9 |
| Montville: | 19.2 |
| Ledyard: | 22.6 |
| Griswold: | 76.7 |
| Lebanon: | 32.8 |
| Canterbury: | 63.7 |
| North Stonington: | 49.1 |
| New London: | 56.0 |
| Waterford: | 24.3 |
 The median response time based on all reported fire incidents is 4 minutes. This is lower compared to the Connecticut median value.
The median response time in Norwich, CT compared to nearest cities:
(Note: Based on data for all years, including only cities with at least 500 fire incidents)
| Norwich: | 4 minutes |
| Preston: | 8 minutes |
| Montville: | 7 minutes |
| Ledyard: | 9 minutes |
| Griswold: | 8 minutes |
| Lebanon: | 12 minutes |
| North Stonington: | 10 minutes |
| New London: | 4 minutes |
| Waterford: | 6 minutes |
 According to the reports from the years 2002 - 2018 the average number of fire-related yearly casualties is 1. The highest number of casualties - 6 took place in 2017, and the lowest - 0 in 2006. The data has a constant trend.
The average number of casualties per 1,000 fires is 8. This indicator was the highest - 37 in 2017, and the lowest 0 in 2006. The trend for casualties per 1,000 fire incidents is dropping. Compared to the Connecticut value the number of injuries per 1,000 incidents is lower.
According to the reports from the years 2002 - 2018 the average number of fire-related yearly casualties is 1. The highest number of casualties - 6 took place in 2017, and the lowest - 0 in 2006. The data has a constant trend.
The average number of casualties per 1,000 fires is 8. This indicator was the highest - 37 in 2017, and the lowest 0 in 2006. The trend for casualties per 1,000 fire incidents is dropping. Compared to the Connecticut value the number of injuries per 1,000 incidents is lower.Casualties per 1,000 incidents in Norwich, CT compared to nearest cities:
(Note: Based on data for all years, including only cities with at least 500 fire incidents)
| Norwich: | 7.6 |
| Preston: | 0.0 |
| Montville: | 4.5 |
| Ledyard: | 14.5 |
| Griswold: | 8.9 |
| Lebanon: | 8.0 |
| North Stonington: | 0.0 |
| New London: | 33.9 |
| Waterford: | 15.9 |
 31.7% incidents where reported in the morning and 68.3% in the evening. The most fires (14.9%) took place on Saturday, and the least (13.7%) on Thursday.
 According to the 2,913 reports from years 2002 - 2018 most fires (12.4%) took place during April, and the least (5.4%) in December.
 Out of all 20,848 cases reported during the years 2002 - 2018, the most belonged to the categories: Rescue & EMS (55.1%), Fire (14.0%), and Hazardous Condition (11.1%).
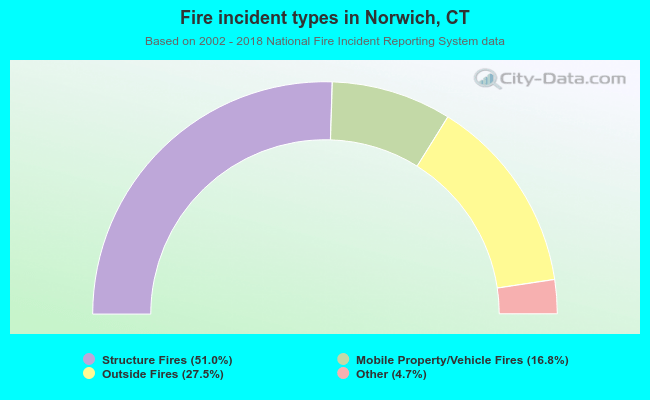 When looking into fire subcategories, the most reports belonged to: Structure Fires (51.0%), and Outside Fires (27.5%).