Preston: Fire Incidents, Connecticut (CT)
Where are fire incidents reported in Preston, CT
Something went wrong! Please refresh the page.
|
| |||||||||||||||||||||||||||||||||||||||||||||||||||||||||||||||||||||||||||||||||||||||||||||||||||||||||||||
2002 - 2018 National Fire Incident Reporting System (NFIRS) incidents
- Incident types reported to NFIRS in Preston, CT
- 3,19358.8%Rescue & EMS
- 74713.8%Hazardous Condition
- 5149.5%Fire
- 4568.4%Service Call
- 3135.8%False Alarm
- 2073.8%Good Intent Call
- Fire incident types reported to NFIRS in Preston, CT
- 20239.3%Outside Fires
- 19137.2%Structure Fires
- 11322.0%Mobile Property/Vehicle Fires
- 81.6%Other
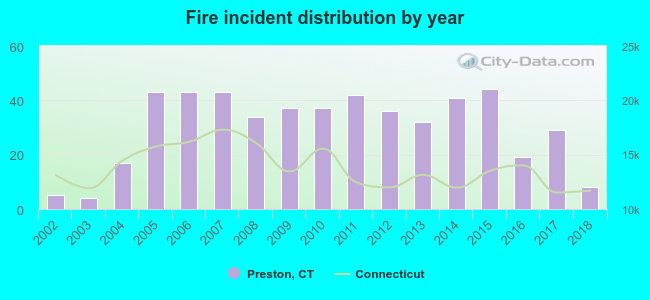 According to the data from the years 2002 - 2018 the average number of fire incidents per year is 30. The highest number of fire incidents - 44 took place in 2015, and the least - 4 in 2003. The data has a growing trend.
 The median response time based on all reported fire incidents is 8 minutes. This is higher than the Connecticut median value.
The median response time in Preston, CT compared to nearest cities:
(Note: Based on data for all years, including only cities with at least 500 fire incidents)
| Preston: | 8 minutes |
| Norwich: | 4 minutes |
| Ledyard: | 9 minutes |
| Griswold: | 8 minutes |
| Montville: | 7 minutes |
| North Stonington: | 10 minutes |
| Mystic: | 5 minutes |
| New London: | 4 minutes |
| Groton: | 4 minutes |
 28.0% incidents where reported in the morning and 72.0% in the evening. The most fires (18.3%) took place on Friday, and the least (10.9%) on Thursday.
 Based on the 514 incident reports from years 2002 - 2018 most fires (12.1%) took place during April, and the least (3.9%) in September.
 Out of all 5,431 cases reported during the years 2002 - 2018, the most belonged to the categories: Rescue & EMS (58.8%), Hazardous Condition (13.8%), and Fire (9.5%).
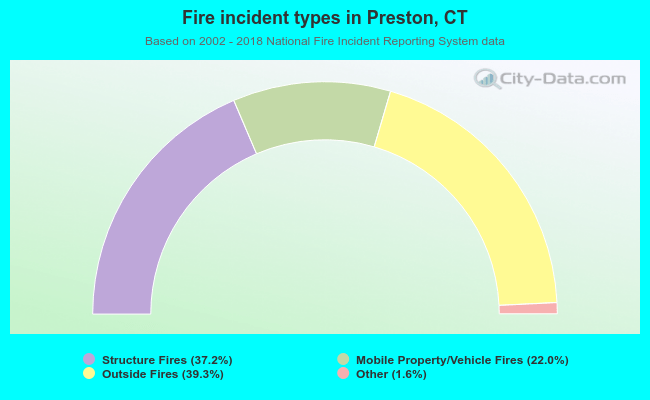 When looking into fire subcategories, the most incidents belonged to: Outside Fires (39.3%), and Structure Fires (37.2%).