Putnam: Fire Incidents, Connecticut (CT)
Where are fire incidents reported in Putnam, CT
Something went wrong! Please refresh the page.
| Fire incidents reported | |
|---|---|
| Sreet name | Count |
| CHURCH ST | 130 |
| KENNEDY DR | 88 |
| SCHOOL ST | 84 |
| PROVIDENCE PIKE | 74 |
| PROVIDENCE ST | 62 |
| WOODSTOCK AVE | 42 |
| POMFRET ST | 34 |
| WALNUT ST | 34 |
| PARK RD | 32 |
| SOUTH MAIN ST | 32 |
| FIVE MILE RIVER RD | 30 |
| INTERSTATE 395 NORTHBOUND HWY | 30 |
| KILLINGLY AVE | 30 |
| GROVE ST | 28 |
| MECHANICS ST | 28 |
| EAST PUTNAM RD | 22 |
| HIGHLAND DR | 22 |
| INTERSTATE 395 SOUTHBOUND HWY | 20 |
| RIVER RD | 18 |
| CANAL ST | 16 |
| MANTUP RD | 16 |
| SABIN ST | 16 |
| FARROWS ST | 14 |
| FLORENCE ST | 14 |
| HERITAGE RD | 14 |
| MAIN ST | 14 |
| ROUTE 44 HWY | 14 |
| VAN DEN NOORT ST | 14 |
| BATTEY ST | 12 |
| LIBERTY HWY | 12 |
2002 - 2018 National Fire Incident Reporting System (NFIRS) incidents
- Incident types reported to NFIRS in Putnam, CT
- 88928.0%Rescue & EMS
- 75923.9%Fire
- 72022.7%Hazardous Condition
- 48815.4%False Alarm
- 1916.0%Service Call
- 842.6%Good Intent Call
- 220.7%Severe Weather
- 150.5%Special Incident
- Fire incident types reported to NFIRS in Putnam, CT
- 29639.0%Structure Fires
- 25032.9%Outside Fires
- 11314.9%Mobile Property/Vehicle Fires
- 10013.2%Other
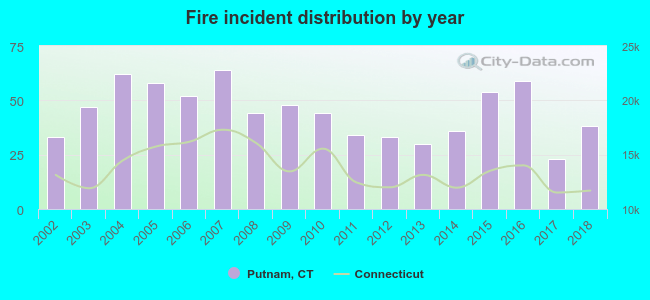 According to the data from the years 2002 - 2018 the average number of fire incidents per year is 45. The highest number of fire incidents - 64 took place in 2007, and the least - 23 in 2017. The data has a growing trend.
The average number of yearly fire incidents per 10k residents in Putnam, CT compared to nearest cities:
(Note: Based on data for the last 3 years, including only cities with population 5,000 and above)
| Putnam: | 41.7 |
| Thompson: | 27.5 |
| Killingly: | 3.6 |
| Woodstock: | 18.8 |
| Brooklyn: | 54.4 |
| Plainfield: | 14.5 |
| Canterbury: | 63.7 |
| Willington: | 14.3 |
| Mansfield: | 6.8 |
 The median response time based on all reported fire incidents is 6 minutes. This is similar to the Connecticut median value.
The median response time in Putnam, CT compared to nearest cities:
(Note: Based on data for all years, including only cities with at least 500 fire incidents)
| Putnam: | 6 minutes |
| Danielson: | 9 minutes |
| Brooklyn: | 8 minutes |
| Moosup: | 8 minutes |
| Plainfield: | 8 minutes |
| Willimantic: | 4 minutes |
| Griswold: | 8 minutes |
 Based on the reports from the years 2002 - 2018 the average number of fire-related casualties per year is 0. The highest number of reported injuries - 2 took place in 2004, and the lowest - 0 in 2002. The data has a constant trend.
The average number of injuries per 1,000 fire incidents is 4. This indicator was the highest - 32 in 2004, and the lowest 0 in 2002. The trend for casualties per 1,000 fires is constant. Compared to the Connecticut value the number of injuries per 1,000 fire incidents is much lower.
Based on the reports from the years 2002 - 2018 the average number of fire-related casualties per year is 0. The highest number of reported injuries - 2 took place in 2004, and the lowest - 0 in 2002. The data has a constant trend.
The average number of injuries per 1,000 fire incidents is 4. This indicator was the highest - 32 in 2004, and the lowest 0 in 2002. The trend for casualties per 1,000 fires is constant. Compared to the Connecticut value the number of injuries per 1,000 fire incidents is much lower.Casualties per 1,000 incidents in Putnam, CT compared to nearest cities:
(Note: Based on data for all years, including only cities with at least 500 fire incidents)
| Putnam: | 5.3 |
| Danielson: | 2.1 |
| Brooklyn: | 5.0 |
| Moosup: | 5.6 |
| Plainfield: | 2.8 |
| Willimantic: | 23.8 |
| Griswold: | 8.9 |
 32.1% incidents where reported in the morning and 67.9% in the evening. The most fires (18.4%) took place on Monday, and the least (10.3%) on Tuesday.
 According to the 759 reports from years 2002 - 2018 most fires (17.1%) took place during April, and the least (5.1%) in August.
 Out of all 3,170 cases reported during the years 2002 - 2018, the most belonged to the categories: Rescue & EMS (28.0%), Fire (23.9%), and Hazardous Condition (22.7%).
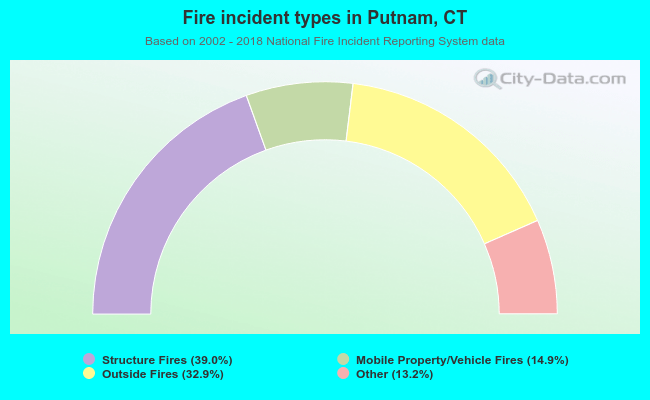 When looking into fire subcategories, the most incidents belonged to: Structure Fires (39.0%), and Outside Fires (32.9%).