Willimantic: Fire Incidents, Connecticut (CT)
Where are fire incidents reported in Willimantic, CT
Something went wrong! Please refresh the page.
| Fire incidents reported | |
|---|---|
| Sreet name | Count |
| MAIN ST | 312 |
| WEST MAIN ST | 184 |
| VILLAGE RD | 144 |
| VALLEY ST | 136 |
| JACKSON ST | 128 |
| VALLEY ST EXT | 110 |
| PLEASANT ST | 102 |
| ASH ST | 86 |
| WINDHAM ST EXT | 78 |
| WINDHAM RD | 60 |
| CHAPMAN ST | 58 |
| CAMEO DR | 54 |
| HIGH ST | 54 |
| OCCUM RD | 52 |
| MANSFIELD AVE | 50 |
| SPRING ST | 50 |
| PROSPECT ST | 48 |
| WEST AVE | 48 |
| EMERALD AVE | 46 |
| MEMORIAL DR | 46 |
| NORTH ST | 44 |
| BROOK ST | 42 |
| SOUTH ST | 42 |
| CHURCH ST | 40 |
| BOSTON POST RD | 38 |
| RECYCLING WAY | 38 |
| COLUMBIA AVE | 36 |
| MAPLE AVE | 34 |
| WINDHAM ST EXT | 34 |
| MOUNTAIN ST | 32 |
2002 - 2018 National Fire Incident Reporting System (NFIRS) incidents
- Incident types reported to NFIRS in Willimantic, CT
- 15,90864.3%Rescue & EMS
- 3,34113.5%Hazardous Condition
- 1,8437.4%False Alarm
- 1,7687.1%Fire
- 9874.0%Good Intent Call
- 8123.3%Service Call
- 420.2%Overpressure Rupture
- 260.1%Severe Weather
- Fire incident types reported to NFIRS in Willimantic, CT
- 92152.1%Structure Fires
- 56732.1%Outside Fires
- 17810.1%Mobile Property/Vehicle Fires
- 1025.8%Other
 Based on the data from the years 2002 - 2018 the average number of fires per year is 104. The highest number of fires - 143 took place in 2006, and the least - 65 in 2015. The data has a declining trend.
The average number of yearly fire incidents per 10k residents in Willimantic, CT compared to nearest cities:
(Note: Based on data for the last 3 years, including only cities with population 5,000 and above)
| Willimantic: | 41.5 |
| Windham: | 5.9 |
| Columbia: | 41.3 |
| Mansfield: | 6.8 |
| Storrs: | 26.1 |
| Lebanon: | 32.8 |
| Coventry: | 10.2 |
| Hebron: | 17.2 |
| Canterbury: | 63.7 |
 The median response time based on all reported fire incidents is 4 minutes. This is lower than the Connecticut median value.
The median response time in Willimantic, CT compared to nearest cities:
(Note: Based on data for all years, including only cities with at least 500 fire incidents)
| Willimantic: | 4 minutes |
| Lebanon: | 12 minutes |
| Coventry: | 7 minutes |
| Colchester: | 8 minutes |
| Tolland: | 8 minutes |
| Norwich: | 4 minutes |
| Brooklyn: | 8 minutes |
| Plainfield: | 8 minutes |
| Vernon: | 5 minutes |
 According to the data from the years 2002 - 2018 the average number of fire-related yearly casualties is 2. The highest number of reported injuries - 9 took place in 2012, and the lowest - 0 in 2009. The data has a decreasing trend.
The average number of injuries per 1,000 fires is 23. This indicator was the highest - 80 in 2012, and the lowest 0 in 2009. The trend for injuries per 1,000 incidents is declining. Compared to the state value the number of casualties per 1,000 fire incidents is higher.
According to the data from the years 2002 - 2018 the average number of fire-related yearly casualties is 2. The highest number of reported injuries - 9 took place in 2012, and the lowest - 0 in 2009. The data has a decreasing trend.
The average number of injuries per 1,000 fires is 23. This indicator was the highest - 80 in 2012, and the lowest 0 in 2009. The trend for injuries per 1,000 incidents is declining. Compared to the state value the number of casualties per 1,000 fire incidents is higher.Casualties per 1,000 incidents in Willimantic, CT compared to nearest cities:
(Note: Based on data for all years, including only cities with at least 500 fire incidents)
| Willimantic: | 23.8 |
| Lebanon: | 8.0 |
| Coventry: | 9.6 |
| Colchester: | 12.9 |
| Tolland: | 0.0 |
| Norwich: | 7.6 |
| Brooklyn: | 5.0 |
| Plainfield: | 2.8 |
| Vernon: | 9.4 |
 29.5% incidents where reported in the morning and 70.5% in the evening. The most fires (15.1%) took place on Tuesday, and the least (13.3%) on Saturday.
 Based on the 1,768 reports from years 2002 - 2018 most fires (10.9%) took place during April, and the least (5.8%) in December.
 Out of all 24,747 cases reported during the years 2002 - 2018, the most belonged to the categories: Rescue & EMS (64.3%), Hazardous Condition (13.5%), and False Alarm (7.4%).
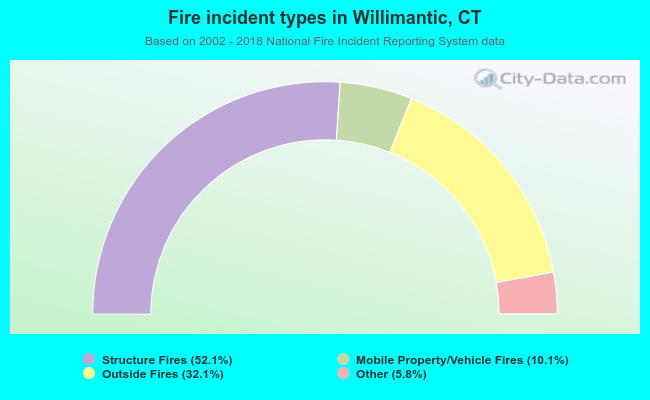 When looking into fire subcategories, the most reports belonged to: Structure Fires (52.1%), and Outside Fires (32.1%).