Hebron: Fire Incidents, Connecticut (CT)
Where are fire incidents reported in Hebron, CT
Something went wrong! Please refresh the page.
|
| |||||||||||||||||||||||||||||||||||||||||||||||||||||||||||||||||||||||||||||||||||||||||||||||||||||||||||||
2002 - 2018 National Fire Incident Reporting System (NFIRS) incidents
- Incident types reported to NFIRS in Hebron, CT
- 1,61547.1%Rescue & EMS
- 53215.5%Hazardous Condition
- 48114.0%Fire
- 34710.1%False Alarm
- 2266.6%Service Call
- 1925.6%Good Intent Call
- 240.7%Severe Weather
- 100.3%Special Incident
- Fire incident types reported to NFIRS in Hebron, CT
- 25452.8%Structure Fires
- 11323.5%Outside Fires
- 9118.9%Other
- 234.8%Mobile Property/Vehicle Fires
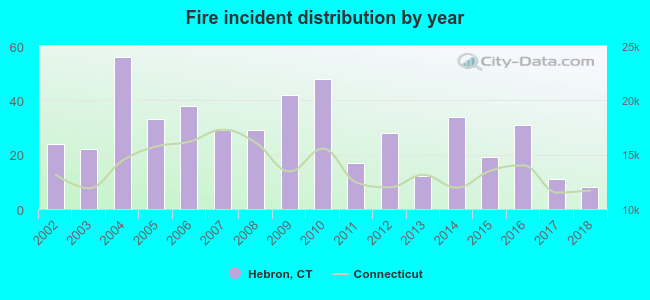 Based on the data from the years 2002 - 2018 the average number of fires per year is 28. The highest number of fires - 56 took place in 2004, and the least - 8 in 2018. The data has a declining trend.
The average number of yearly fire incidents per 10k residents in Hebron, CT compared to nearest cities:
(Note: Based on data for the last 3 years, including only cities with population 5,000 and above)
| Hebron: | 17.2 |
| Marlborough: | 23.9 |
| Columbia: | 41.3 |
| Colchester: | 31.3 |
| Lebanon: | 32.8 |
| Coventry: | 10.2 |
| Willimantic: | 41.5 |
| Glastonbury: | 19.0 |
| Windham: | 5.9 |
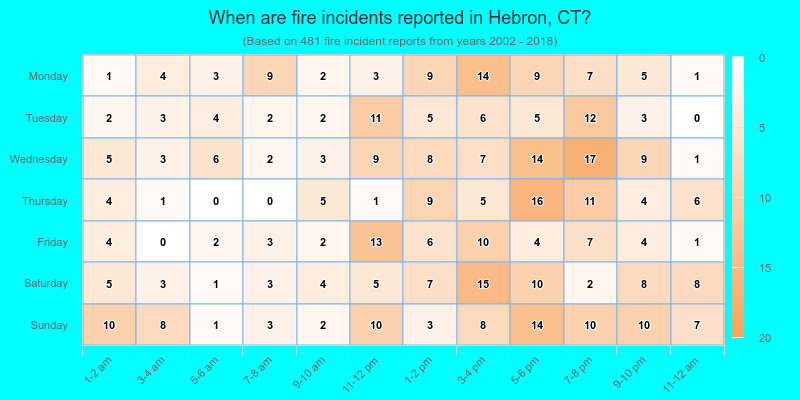
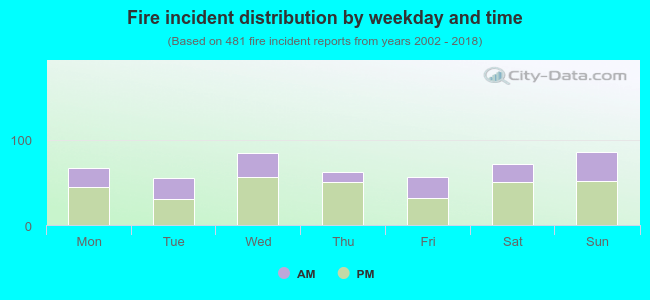 34.1% incidents where reported in the morning and 65.9% in the evening. The most fires (17.9%) took place on Sunday, and the least (11.4%) on Tuesday.
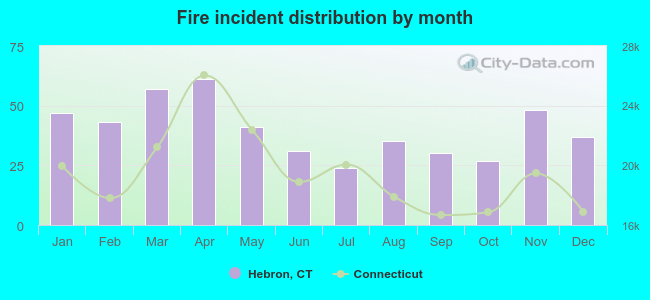 Based on the 481 reports from years 2002 - 2018 most fires (12.7%) took place during April, and the least (5.0%) in July.
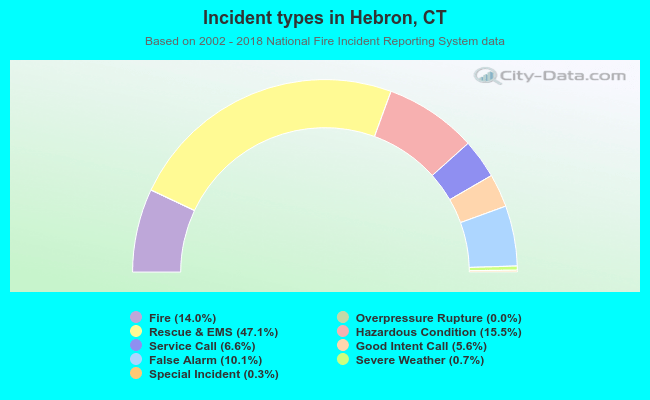 Out of all 3,428 cases reported during the years 2002 - 2018, the most belonged to the categories: Rescue & EMS (47.1%), Hazardous Condition (15.5%), and Fire (14.0%).
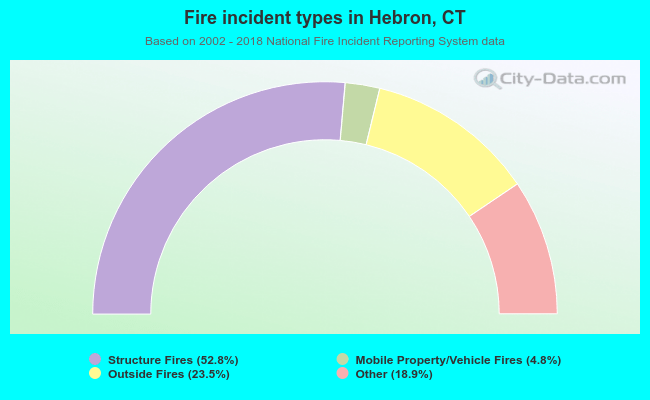 When looking into fire subcategories, the most incidents belonged to: Structure Fires (52.8%), and Outside Fires (23.5%).