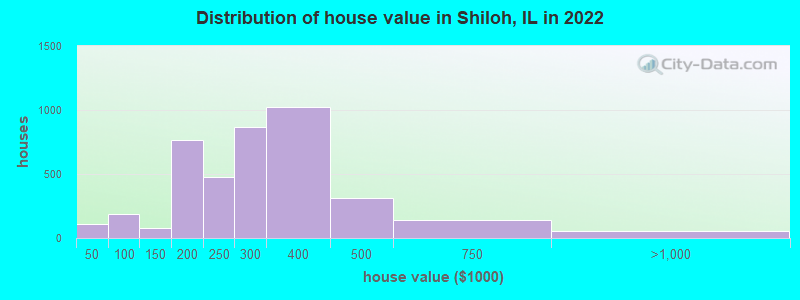
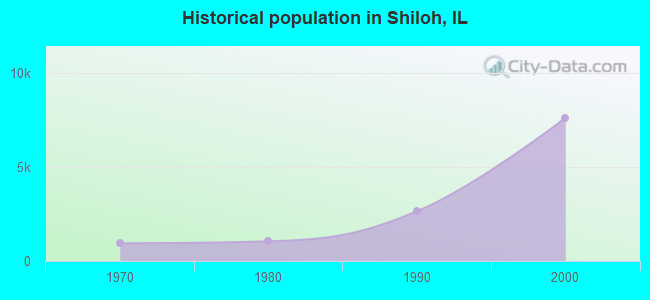
Estimated median house or condo value in 2022: $283,214 (it was $129,000 in 2000)
Shiloh:
$283,214
IL:
$251,600
Mean prices in 2022:all housing units: $186,345; detached houses: $193,799; townhouses or other attached units: $211,600; in 2-unit structures: $145,942; in 3-to-4-unit structures: $159,029; in 5-or-more-unit structures: $252,106; mobile homes: $52,353
Median gross rent in 2022: $1,104.
March 2022 cost of living index in Shiloh: 95.8 (near average, U.S. average is 100)
Percentage of residents living in poverty in 2022: 6.1%
(5.9% for White Non-Hispanic residents, 5.9% for Black residents, 10.4% for Hispanic or Latino residents, 12.5% for other race residents, 5.9% for two or more races residents)
According to our research of Illinois and other state lists, there were 8 registered sex offenders living in Shiloh, Illinois as of May 26, 2024. The ratio of all residents to sex offenders in Shiloh is 1,625 to 1. The ratio of registered sex offenders to all residents in this city is lower than the state average.
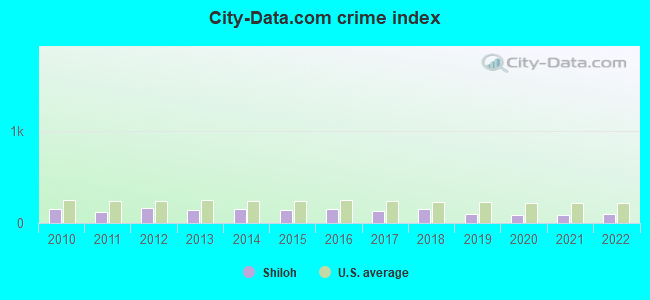
Crime rates in Shiloh by year
Type
2010
2011
2012
2013
2014
2015
2016
2017
2018
2019
2020
2021
2022
Murders (per 100,000)
0 (0.0)
0 (0.0)
0 (0.0)
0 (0.0)
0 (0.0)
1 (7.7)
0 (0.0)
1 (7.6)
0 (0.0)
0 (0.0)
0 (0.0)
2 (14.5)
0 (0.0)
Rapes (per 100,000)
7 (55.3)
4 (31.5)
8 (63.0)
5 (37.8)
9 (69.3)
2 (15.4)
4 (30.6)
5 (38.2)
12 (91.1)
3 (22.8)
6 (43.8)
1 (7.3)
6 (41.1)
Robberies (per 100,000)
4 (31.6)
3 (23.6)
3 (23.6)
7 (53.0)
4 (30.8)
5 (38.4)
7 (53.6)
2 (15.3)
4 (30.4)
2 (15.2)
0 (0.0)
2 (14.5)
0 (0.0)
Assaults (per 100,000)
10 (79.0)
14 (110.3)
12 (94.5)
13 (98.4)
11 (84.7)
15 (115.2)
18 (137.9)
7 (53.5)
6 (45.6)
8 (60.7)
10 (73.0)
8 (58.1)
9 (61.6)
Burglaries (per 100,000)
51 (403.1)
43 (338.9)
60 (472.5)
37 (280.0)
42 (323.3)
37 (284.1)
38 (291.1)
51 (389.5)
32 (243.0)
14 (106.2)
9 (65.7)
11 (79.9)
9 (61.6)
Thefts (per 100,000)
158 (1,249)
131 (1,032)
160 (1,260)
163 (1,234)
138 (1,062)
159 (1,221)
177 (1,356)
119 (908.8)
121 (919.0)
167 (1,267)
91 (664.2)
70 (508.7)
75 (513.1)
Auto thefts (per 100,000)
11 (86.9)
8 (63.0)
0 (0.0)
7 (53.0)
4 (30.8)
8 (61.4)
8 (61.3)
4 (30.5)
6 (45.6)
8 (60.7)
17 (124.1)
11 (79.9)
47 (321.6)
Arson (per 100,000)
1 (7.9)
1 (7.9)
0 (0.0)
0 (0.0)
1 (7.7)
2 (15.4)
1 (7.7)
1 (7.6)
2 (15.2)
1 (7.6)
2 (14.6)
0 (0.0)
0 (0.0)
City-Data.com crime index
154.7
124.4
159.9
139.0
149.2
135.8
147.7
127.2
148.6
97.9
90.7
83.2
95.7
The City-Data.com crime index weighs serious crimes and violent crimes more heavily. Higher means more crime, U.S. average is 246.1. It adjusts for the number of visitors and daily workers commuting into cities.
Latest news from Shiloh, IL collected exclusively by city-data.com from local newspapers, TV, and radio stations
Ancestries: German (17.9%), English (6.2%), American (5.7%), French (5.5%), Jamaican (2.8%), Irish (2.1%).
Current Local Time: CST time zone
Incorporated on 10/13/1905
Elevation: 660 feet
Land area: 10.1 square miles.
Population density: 1,442 people per square mile (low).
525 residents are foreign born (1.8% Asia, 1.0% Latin America, 0.5% Africa).
This village:
3.8%
Illinois:
14.1%
Median real estate property taxes paid for housing units with mortgages in 2022: $4,949 (1.7%) Median real estate property taxes paid for housing units with no mortgage in 2022: $4,549 (2.1%)
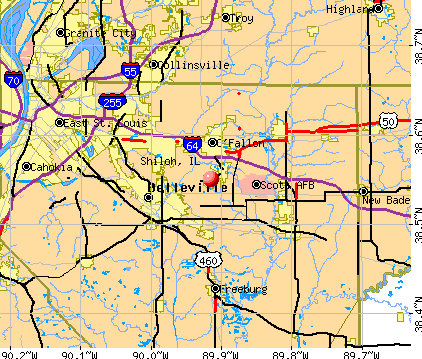
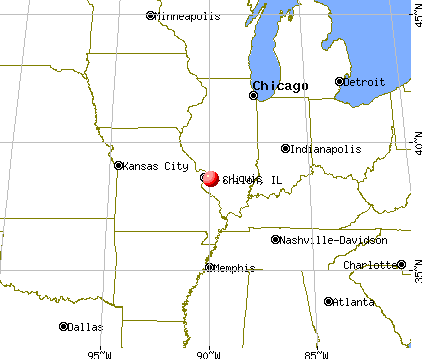
Nearest city with pop. 50,000+: St. Louis, MO (18.5 miles , pop. 348,189).
Nearest city with pop. 1,000,000+: Chicago, IL (256.4 miles , pop. 2,896,016).
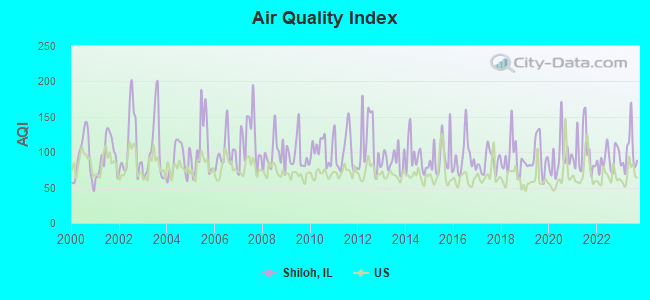
Air Quality Index (AQI) level in 2023 was 99.1. This is worse than average.
City:
99.1
U.S.:
72.6
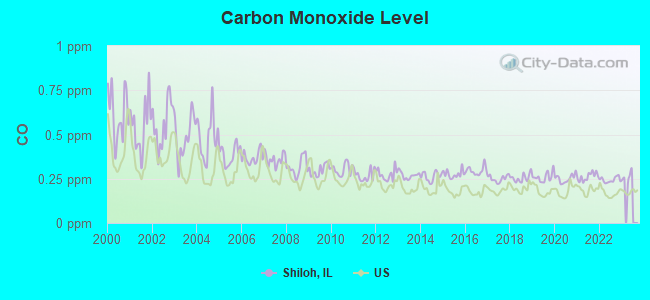
Carbon Monoxide (CO) [ppm] level in 2022 was 0.244. This is about average.Closest monitor was 5.3 miles away from the city center.
City:
0.244
U.S.:
0.251
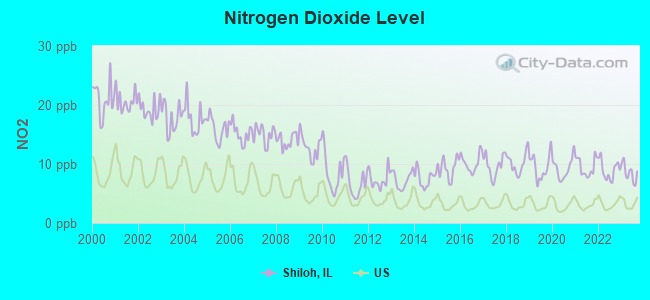
Nitrogen Dioxide (NO2) [ppb] level in 2023 was 8.53. This is significantly worse than average.Closest monitor was 5.3 miles away from the city center.
City:
8.53
U.S.:
5.11
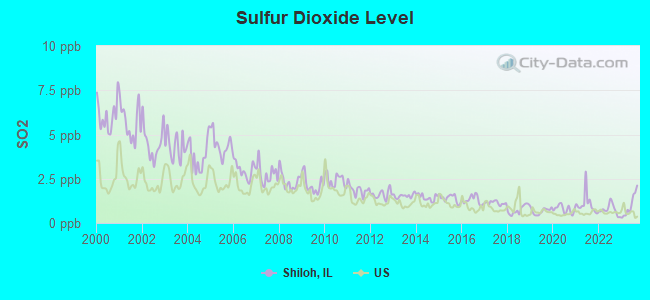
Sulfur Dioxide (SO2) [ppb] level in 2023 was 0.993. This is significantly better than average.Closest monitor was 11.5 miles away from the city center.
City:
0.993
U.S.:
1.515
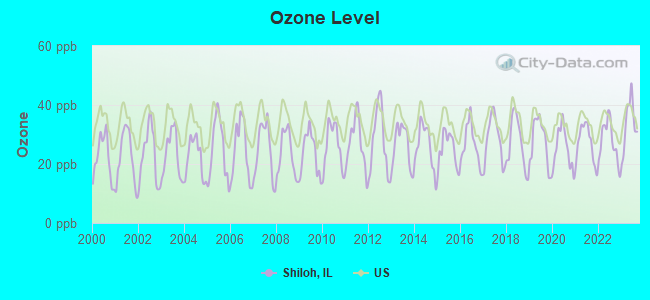
Ozone [ppb] level in 2023 was 33.6. This is about average.Closest monitor was 5.3 miles away from the city center.
City:
33.6
U.S.:
33.3
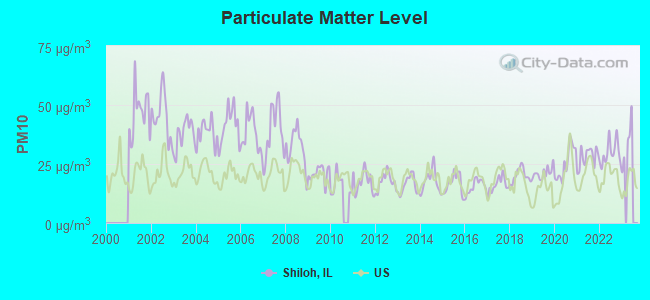
Particulate Matter (PM10) [µg/m3] level in 2022 was 29.8. This is significantly worse than average.Closest monitor was 14.0 miles away from the city center.
City:
29.8
U.S.:
19.2
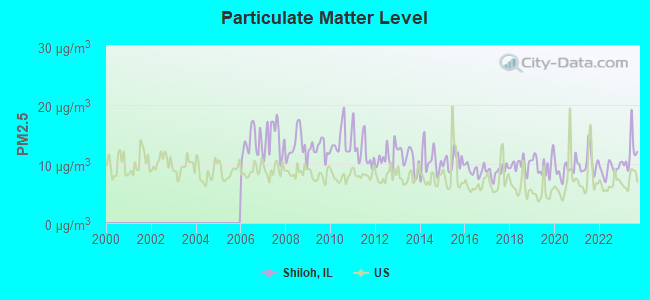
Particulate Matter (PM2.5) [µg/m3] level in 2023 was 11.8. This is significantly worse than average.Closest monitor was 4.5 miles away from the city center.
City:
11.8
U.S.:
8.1
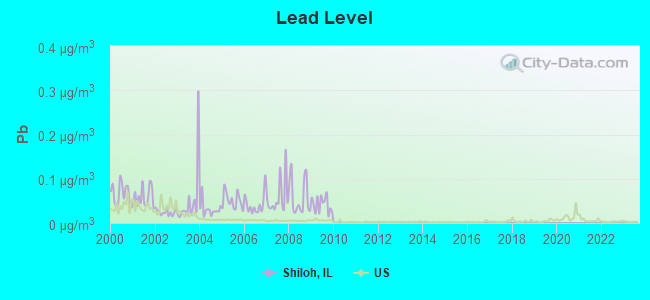
Lead (Pb) [µg/m3] level in 2009 was 0.0418. This is significantly worse than average.Closest monitor was 4.6 miles away from the city center.
City:
0.0418
U.S.:
0.0093
Tornado activity:
Shiloh-area historical tornado activity is slightly above Illinois state average. It is 92% greater than the overall U.S. average.
On 2/10/1959, a category F4 (max. wind speeds 207-260 mph) tornado 15.2 miles away from the Shiloh village center killed 21 peopleand injured 345 peopleand causedbetween $5,000,000 and $50,000,000 in damages.
On 4/3/1981, a category F4 tornado 16.5 miles away from the village center injured 32 peopleand causedbetween $5,000,000 and $50,000,000 in damages.
Earthquake activity:
Shiloh-area historical earthquake activity is significantly above Illinois state average. It is 303% greater than the overall U.S. average.
On 4/18/2008 at 09:36:59, a magnitude 5.4 (5.1 MB, 4.8 MS, 5.4 MW, 5.2 MW, Class: Moderate, Intensity: VI - VII) earthquake occurred 110.0 miles away from Shiloh center On 4/18/2008 at 09:36:59, a magnitude 5.2 (5.2 MW, Depth: 8.9 mi) earthquake occurred 110.0 miles away from the city center On 6/10/1987 at 23:48:54, a magnitude 5.1 (4.9 MB, 4.4 MS, 4.6 MS, 5.1 LG) earthquake occurred 111.2 miles away from the city center On 9/26/1990 at 13:18:51, a magnitude 5.0 (4.7 MB, 4.8 LG, 5.0 LG, Depth: 7.7 mi) earthquake occurred 97.9 miles away from Shiloh center On 6/18/2002 at 17:37:15, a magnitude 5.0 (4.3 MB, 4.6 MW, 5.0 LG) earthquake occurred 122.3 miles away from Shiloh center On 5/4/1991 at 01:18:54, a magnitude 5.0 (4.4 MB, 4.6 LG, 5.0 LG, Depth: 3.1 mi) earthquake occurred 137.5 miles away from Shiloh center Magnitude types: regional Lg-wave magnitude (LG), body-wave magnitude (MB), surface-wave magnitude (MS), moment magnitude (MW)
Natural disasters:
The number of natural disasters in St. Clair County (2) is a lot smaller than the US average (15).
Causes of natural disasters: Flood: 1, Storm: 1, Other: 1 (Note: some incidents may be assigned to more than one category).
Hospitals and medical centers near Shiloh:
AMEDISYS HOME HEALTH (Home Health Center, about 3 miles away; BELLEVILLE, IL)
O'FALLON HEALTH CARE (Nursing Home, about 3 miles away; O FALLON, IL)
VIP HEALTHCARE PROFESSIONALS, LLC (Home Health Center, about 3 miles away; BELLEVILLE, IL)
GREENWOOD TERRACE NRSG AND REHAB (Nursing Home, about 4 miles away; SWANSEA, IL)
ROSEWOOD CARE CENTER OF SWANSEA (Nursing Home, about 4 miles away; SWANSEA, IL)
SOUTHWESTERN IL VISITING NURSE ASSOC (Home Health Center, about 4 miles away; SWANSEA, IL)
CRESCENT HOME HEALTH AGENCY, LLC (Home Health Center, about 4 miles away; SWANSEA, IL)
Amtrak station near Shiloh:
17 miles: ST. LOUIS (550 S. 16TH ST.) . Services: ticket office, partially wheelchair accessible, enclosed waiting area, public restrooms, public payphones, vending machines, free short-term parking, free long-term parking, call for car rental service, taxi stand.
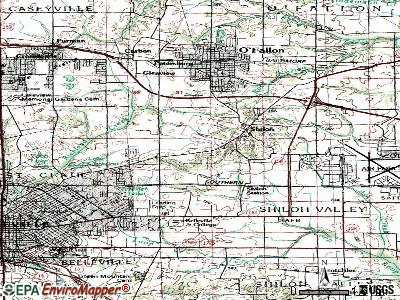
Notable locations in Shiloh: Tamarack Country Club (A), Diocesan Pastoral Center (B), O'Fallon - Shiloh Valley - Caseyville Township Fire Protection District - Shiloh Station (C), East Side Fire Protection District Station 2 (D). Display/hide their locations on the map
Churches in Shiloh include: Bethel Tabernacle Church (A), Corpus Christi Church (B), Shiloh Methodist Church (C), Poor Clairs Monastery (D), Mount Pleasant Baptist Church (E). Display/hide their locations on the map
Cemeteries: Mount Calvary Cemetery (1), Engelmann Cemetery (2), Willoughby Cemetery (3), Saint Johns Orphanage Cemetery (4), Shiloh Valley Cemetery (5). Display/hide their locations on the map
Birthplace of: Roy Hawes - Major League Baseball player.
St. Clair County has a predicted average indoor radon screening level between 2 and 4 pCi/L (pico curies per liter) - Moderate Potential
Average household size:
This village:
2.6 people
Illinois:
2.6 people
Percentage of family households:
This village:
72.1%
Whole state:
65.8%
Percentage of households with unmarried partners:
This village:
6.4%
Whole state:
6.3%
Likely homosexual households (counted as self-reported same-sex unmarried-partner households)
Lesbian couples: 0.3% of all households
Gay men: 0.2% of all households
236 people in military barracks and dormitories (nondisciplinary) in 2010
15 people in other noninstitutional facilities in 2010
329 people in military barracks, etc. in 2000
5 people in homes for the mentally retarded in 2000
Banks with branches in Shiloh (2011 data):
First Bank: Green Mount Crossing Branch at 4040 Green Mount Crossing Drive, branch established on 2003/04/22; Shiloh Facility at 105 North Main, branch established on 1983/06/06. Info updated 2007/12/04: Bank assets: $6,579.8 mil, Deposits: $5,800.6 mil, headquarters in Creve Coeur, MO, negative income in the last year, Commercial Lending Specialization, 148 total offices, Holding Company: First Banks, Inc.
Commerce Bank: Shiloh Banking Center Branch at 4400 Green Mount Crossing Dr, branch established on 2003/08/20. Info updated 2011/07/07: Bank assets: $20,493.6 mil, Deposits: $16,805.3 mil, headquarters in Kansas City, MO, positive income, 206 total offices, Holding Company: Commerce Bancshares, Inc.
Bank of Springfield: Shiloh Branch at 1770 Frank Scott Parkway East, branch established on 2010/09/07. Info updated 2010/10/01: Bank assets: $727.9 mil, Deposits: $610.4 mil, headquarters in Springfield, IL, positive income, Commercial Lending Specialization, 9 total offices, Holding Company: Spring Bancorp, Inc.
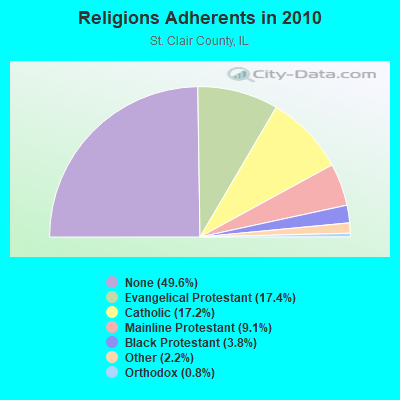
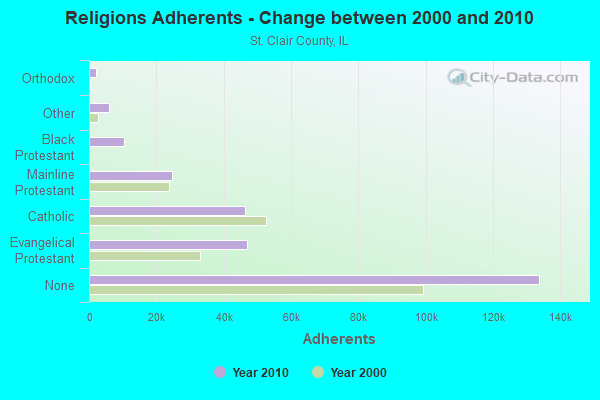
Religion statistics for Shiloh, IL (based on St. Clair County data)
Religion
Adherents
Congregations
Evangelical Protestant
46,903
169
Catholic
46,372
28
Mainline Protestant
24,655
53
Black Protestant
10,290
41
Other
5,880
16
Orthodox
2,100
2
None
133,856
-
Source: Clifford Grammich, Kirk Hadaway, Richard Houseal, Dale E.Jones, Alexei Krindatch, Richie Stanley and Richard H.Taylor. 2012. 2010 U.S.Religion Census: Religious Congregations & Membership Study. Association of Statisticians of American Religious Bodies. Jones, Dale E., et al. 2002. Congregations and Membership in the United States 2000. Nashville, TN: Glenmary Research Center. Graphs represent county-level data
Aircraft: CESSNA 421B (Category: Land, Engines: 2, Seats: 8, Weight: Up to 12,499 Pounds, Speed: 172 mph), Engine: CONT MOTOR GTSIO-520-C (340 HP) (Reciprocating) N-Number: 100AJ, N100AJ, N-100AJ, Serial Number: 421B0322, Year manufactured: 1972, Airworthiness Date: 01/20/1973, Certificate Issue Date: 01/04/2017 Registrant (LLC): N8006j LLC, 4020 Green Mount Crossing Dr / # 158, Shiloh, IL 62269
Aircraft: MOONEY AIRPLANE CO INC M20TN (Category: Land, Seats: 4, Weight: Up to 12,499 Pounds), Engine: CONT MOTOR TSIO-550-G (280 HP) (Reciprocating) N-Number: 237RB, N237RB, N-237RB, Serial Number: 31-0025, Year manufactured: 2007, Airworthiness Date: 02/27/2007, Certificate Issue Date: 08/23/2012 Registrant (LLC): Med Ex LLC, 4020 Green Mount Crossing Dr / # 158, Shiloh, IL 62269
Home Mortgage Disclosure Act Aggregated Statistics For Year 2009 (Based on 5 partial tracts)
A) FHA, FSA/RHS & VA Home Purchase Loans
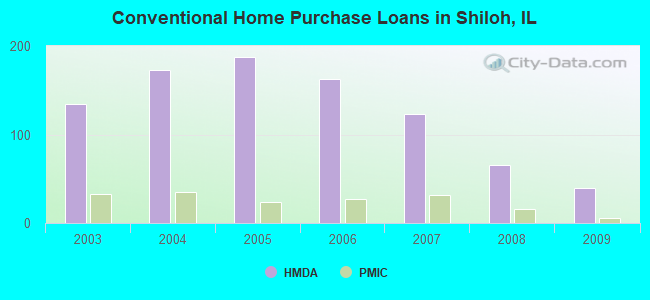
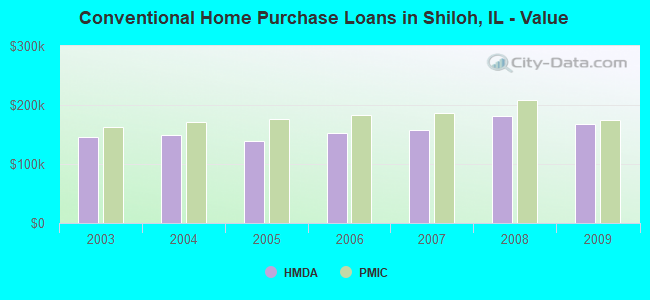
B) Conventional Home Purchase Loans
C) Refinancings
D) Home Improvement Loans
E) Loans on Dwellings For 5+ Families
F) Non-occupant Loans on < 5 Family Dwellings (A B C & D)
G) Loans On Manufactured Home Dwelling (A B C & D)
Number
Average Value
Number
Average Value
Number
Average Value
Number
Average Value
Number
Average Value
Number
Average Value
Number
Average Value
LOANS ORIGINATED
53
$179,133
39
$167,248
325
$181,785
12
$70,071
1
$84,340
16
$120,351
3
$29,863
APPLICATIONS APPROVED, NOT ACCEPTED
2
$209,265
4
$145,025
23
$190,467
2
$10,120
0
$0
1
$147,800
1
$33,910
APPLICATIONS DENIED
5
$137,712
8
$123,746
49
$196,892
11
$31,075
0
$0
2
$92,660
5
$41,956
APPLICATIONS WITHDRAWN
5
$186,042
5
$145,340
68
$182,900
2
$75,425
0
$0
4
$127,775
1
$22,470
FILES CLOSED FOR INCOMPLETENESS
1
$352,070
1
$126,150
10
$204,379
0
$0
0
$0
1
$72,440
0
$0
Aggregated Statistics For Year 2008 (Based on 5 partial tracts)
A) FHA, FSA/RHS & VA Home Purchase Loans
B) Conventional Home Purchase Loans
C) Refinancings
D) Home Improvement Loans
E) Loans on Dwellings For 5+ Families
F) Non-occupant Loans on < 5 Family Dwellings (A B C & D)
G) Loans On Manufactured Home Dwelling (A B C & D)
Number
Average Value
Number
Average Value
Number
Average Value
Number
Average Value
Number
Average Value
Number
Average Value
Number
Average Value
LOANS ORIGINATED
51
$187,589
66
$181,887
135
$187,118
22
$65,594
3
$174,013
16
$149,249
3
$376,687
APPLICATIONS APPROVED, NOT ACCEPTED
3
$186,857
6
$138,897
20
$174,982
4
$71,978
0
$0
4
$75,215
1
$24,510
APPLICATIONS DENIED
7
$209,229
8
$175,058
53
$180,036
16
$72,065
0
$0
5
$104,630
2
$39,560
APPLICATIONS WITHDRAWN
3
$189,187
11
$154,670
40
$182,648
5
$129,418
0
$0
1
$137,480
0
$0
FILES CLOSED FOR INCOMPLETENESS
1
$183,940
1
$337,350
3
$235,470
1
$68,030
0
$0
0
$0
0
$0
Aggregated Statistics For Year 2007 (Based on 5 partial tracts)
A) FHA, FSA/RHS & VA Home Purchase Loans
B) Conventional Home Purchase Loans
C) Refinancings
D) Home Improvement Loans
E) Loans on Dwellings For 5+ Families
F) Non-occupant Loans on < 5 Family Dwellings (A B C & D)
G) Loans On Manufactured Home Dwelling (A B C & D)
Number
Average Value
Number
Average Value
Number
Average Value
Number
Average Value
Number
Average Value
Number
Average Value
Number
Average Value
LOANS ORIGINATED
31
$199,764
123
$157,281
131
$157,393
30
$60,860
2
$2,005,120
23
$113,414
4
$44,598
APPLICATIONS APPROVED, NOT ACCEPTED
1
$196,750
10
$149,522
23
$135,619
7
$93,081
0
$0
1
$96,940
1
$43,410
APPLICATIONS DENIED
4
$186,432
14
$120,456
71
$166,335
17
$146,631
0
$0
3
$105,350
4
$41,902
APPLICATIONS WITHDRAWN
4
$200,922
11
$162,991
40
$171,195
6
$96,150
0
$0
0
$0
0
$0
FILES CLOSED FOR INCOMPLETENESS
0
$0
2
$255,245
13
$159,793
1
$120,510
0
$0
0
$0
0
$0
Aggregated Statistics For Year 2006 (Based on 5 partial tracts)
A) FHA, FSA/RHS & VA Home Purchase Loans
B) Conventional Home Purchase Loans
C) Refinancings
D) Home Improvement Loans
E) Loans on Dwellings For 5+ Families
F) Non-occupant Loans on < 5 Family Dwellings (A B C & D)
G) Loans On Manufactured Home Dwelling (A B C & D)
Number
Average Value
Number
Average Value
Number
Average Value
Number
Average Value
Number
Average Value
Number
Average Value
Number
Average Value
LOANS ORIGINATED
43
$200,940
163
$152,795
142
$133,682
31
$42,073
3
$403,443
27
$106,331
5
$27,674
APPLICATIONS APPROVED, NOT ACCEPTED
3
$182,823
18
$138,620
25
$146,767
5
$56,474
0
$0
2
$165,570
3
$63,623
APPLICATIONS DENIED
2
$188,670
23
$154,321
66
$146,865
16
$59,049
0
$0
6
$129,902
4
$41,628
APPLICATIONS WITHDRAWN
2
$207,050
17
$138,270
47
$152,217
5
$114,298
0
$0
4
$90,718
0
$0
FILES CLOSED FOR INCOMPLETENESS
0
$0
4
$157,315
12
$176,978
0
$0
0
$0
0
$0
0
$0
Aggregated Statistics For Year 2005 (Based on 5 partial tracts)
A) FHA, FSA/RHS & VA Home Purchase Loans
B) Conventional Home Purchase Loans
C) Refinancings
D) Home Improvement Loans
E) Loans on Dwellings For 5+ Families
F) Non-occupant Loans on < 5 Family Dwellings (A B C & D)
G) Loans On Manufactured Home Dwelling (A B C & D)
Number
Average Value
Number
Average Value
Number
Average Value
Number
Average Value
Number
Average Value
Number
Average Value
Number
Average Value
LOANS ORIGINATED
45
$172,909
188
$138,768
169
$143,078
24
$52,446
1
$231,580
33
$94,329
5
$47,960
APPLICATIONS APPROVED, NOT ACCEPTED
2
$115,850
21
$131,919
30
$141,177
6
$46,592
0
$0
2
$79,745
2
$60,550
APPLICATIONS DENIED
3
$141,270
25
$115,644
74
$144,551
15
$26,093
0
$0
7
$98,173
6
$31,278
APPLICATIONS WITHDRAWN
1
$300,980
22
$126,224
59
$165,719
3
$101,970
0
$0
5
$83,318
0
$0
FILES CLOSED FOR INCOMPLETENESS
1
$115,350
6
$108,418
11
$152,025
1
$25,370
0
$0
1
$133,260
0
$0
Aggregated Statistics For Year 2004 (Based on 5 partial tracts)
A) FHA, FSA/RHS & VA Home Purchase Loans
B) Conventional Home Purchase Loans
C) Refinancings
D) Home Improvement Loans
E) Loans on Dwellings For 5+ Families
F) Non-occupant Loans on < 5 Family Dwellings (A B C & D)
G) Loans On Manufactured Home Dwelling (A B C & D)
Number
Average Value
Number
Average Value
Number
Average Value
Number
Average Value
Number
Average Value
Number
Average Value
Number
Average Value
LOANS ORIGINATED
43
$166,156
173
$148,927
184
$137,619
17
$45,456
2
$495,895
23
$100,928
4
$37,502
APPLICATIONS APPROVED, NOT ACCEPTED
2
$146,170
17
$170,081
26
$126,030
3
$53,543
0
$0
4
$177,460
1
$32,330
APPLICATIONS DENIED
3
$161,610
25
$125,793
71
$136,580
15
$55,642
0
$0
6
$93,097
6
$39,175
APPLICATIONS WITHDRAWN
2
$202,155
11
$129,585
50
$138,237
2
$39,770
0
$0
3
$111,193
0
$0
FILES CLOSED FOR INCOMPLETENESS
1
$130,880
4
$137,630
6
$158,267
1
$46,080
0
$0
1
$19,110
0
$0
Aggregated Statistics For Year 2003 (Based on 5 partial tracts)
A) FHA, FSA/RHS & VA Home Purchase Loans
B) Conventional Home Purchase Loans
C) Refinancings
D) Home Improvement Loans
E) Loans on Dwellings For 5+ Families
F) Non-occupant Loans on < 5 Family Dwellings (A B C & D)
2002 - 2018 National Fire Incident Reporting System (NFIRS) incidents
Based on the data from the years 2002 - 2018 the average number of fire incidents per year is 16. The highest number of reported fires - 41 took place in 2006, and the least - 5 in 2016. The data has a dropping trend.
When looking into fire subcategories, the most reports belonged to: Structure Fires (48.9%), and Outside Fires (30.4%).
Fire incident types reported to NFIRS in Shiloh, IL
#92 on the list of "Top 101 cities with the largest percentage of people in military barracks, etc. (population 1,000+)"
#101 on the list of "Top 101 cities with the largest city-data.com crime index increase from 2002 to 2012 (population 5,000+)"
#22 on the list of "Top 101 counties with the largest decrease in the number of infant deaths per 1000 residents 2000-2006 to 2007-2013 (pop. 50,000+)"
#41 on the list of "Top 101 counties with the highest Nitrogen Dioxide air pollution readings in 2012 (ppm)"
#61 on the list of "Top 101 counties with the lowest Ozone (1-hour) air pollution readings in 2012 (ppm)"
#75 on the list of "Top 101 counties with the highest Sulfur Oxides Annual air pollution readings in 2012 (µg/m3)"
#76 on the list of "Top 101 counties with the highest percentage of residents relocating from foreign countries between 2010 and 2011 (pop. 50,000+)"


 Recent articles from our blog. Our writers, many of them Ph.D. graduates or candidates, create easy-to-read articles on a wide variety of topics.

 (18.5 miles


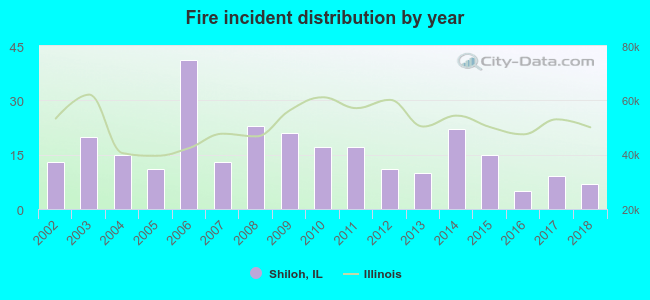 Based on the data from the years 2002 - 2018 the average number of fire incidents per year is 16. The highest number of reported fires - 41 took place in 2006, and the least - 5 in 2016. The data has a dropping trend.
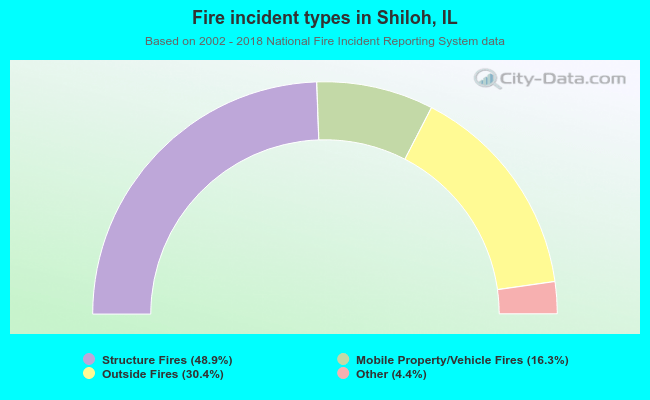 When looking into fire subcategories, the most reports belonged to: Structure Fires (48.9%), and Outside Fires (30.4%).