Shiloh: Fire Incidents, Illinois (IL)
Where are fire incidents reported in Shiloh, IL
Something went wrong! Please refresh the page.
|
| |||||||||||||||||||||||||||||||||||||||||||||||||||||||||||||||||||||||||||||||||||||||||||||||||||||||||||||
2002 - 2018 National Fire Incident Reporting System (NFIRS) incidents
- Incident types reported to NFIRS in Shiloh, IL
- 55840.0%Hazardous Condition
- 28620.5%False Alarm
- 27019.4%Fire
- 15110.8%Good Intent Call
- 836.0%Service Call
- 342.4%Rescue & EMS
- 110.8%Severe Weather
- Fire incident types reported to NFIRS in Shiloh, IL
- 13248.9%Structure Fires
- 8230.4%Outside Fires
- 4416.3%Mobile Property/Vehicle Fires
- 124.4%Other
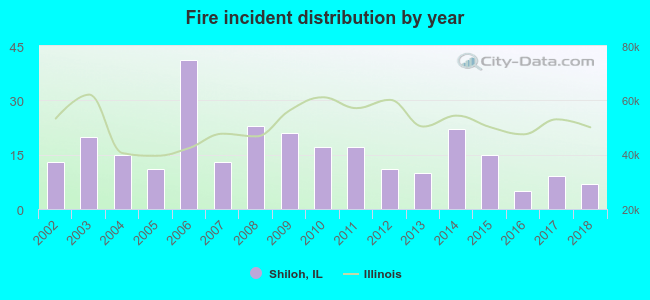 Based on the data from the years 2002 - 2018 the average number of fire incidents per year is 16. The highest number of fires - 41 took place in 2006, and the least - 5 in 2016. The data has a decreasing trend.
The average number of yearly fire incidents per 10k residents in Shiloh, IL compared to nearest cities:
(Note: Based on data for the last 3 years, including only cities with population 5,000 and above)
| Shiloh: | 5.4 |
| Swansea: | 29.8 |
| Belleville: | 74.5 |
| Fairview Heights: | 48.7 |
| Mascoutah: | 39.8 |
| Collinsville: | 53.9 |
| Centreville: | 233.1 |
| Maryville: | 3.8 |
| Troy: | 44.4 |

 According to the reports from the years 2002 - 2018 the average number of fire-related yearly casualties is 0. The highest number of reported injuries - 1 took place in 2004, and the lowest - 0 in 2002. The data has a constant trend.
 31.5% incidents where reported in the morning and 68.5% in the evening. The most fires (17.0%) took place on Saturday, and the least (11.5%) on Thursday.
 According to the 270 incident reports from years 2002 - 2018 most fires (11.1%) took place during July, and the least (4.1%) in February.
 Out of all 1,394 cases reported during the years 2002 - 2018, the most belonged to the categories: Rescue & EMS (40.0%), Good Intent Call (20.5%), and Fire (19.4%).
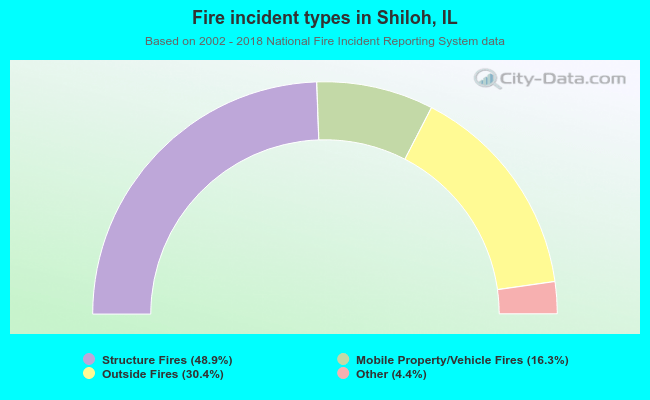 When looking into fire subcategories, the most incidents belonged to: Structure Fires (48.9%), and Outside Fires (30.4%).