Races in Shiloh, Illinois (IL) Detailed Stats
Ancestries, Foreign-born residents, place of birth
Settings
X


Recent posts about races in Shiloh, Illinois on our local forum with over 2,400,000 registered users:
 | Need info about Scott AFB area (3 replies) |
| Alton, Granite City, and other communities (32 replies) |
| Any advise about Zion, IL (14 replies) |
| Military working in St Louis, MO, want to live in Belleville,IL: Where do I live that is safe (12 replies) |
| Diversity in Belleville/OFallon/Collinsville/Fairview Heights area? (9 replies) |
| Any info on Zion? (8 replies) |
Latest news about races in Shiloh, IL collected exclusively by city-data.com from local newspapers, TV, and radio stations
According to 2022 data, the most numerous races in Shiloh, IL are White alone (8,880 residents), Hispanic (646 residents), and Black alone (2,874 residents). 92.9% of Shiloh residents speak English at home. 3.8% of Shiloh, IL residents are foreign-born (1.8% born in Asia, 1.0% born in Latin America, 0.5% born in Africa), which is 264.5% less than the foreign-born rate of 14.0% across the entire state of Illinois.
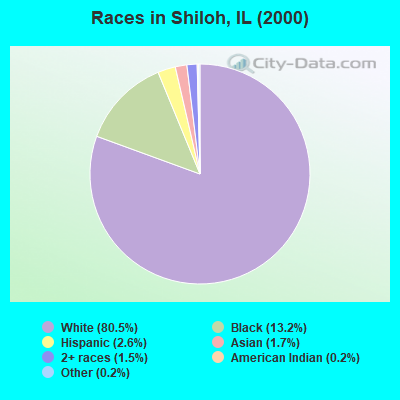
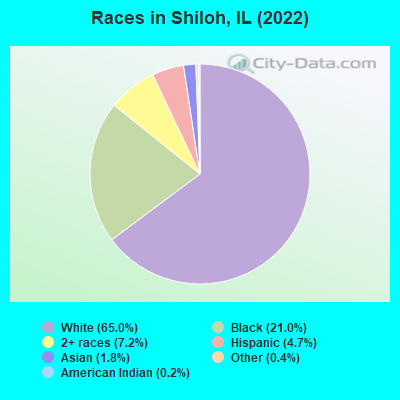
Race distribution in Shiloh
2000
2022

- 6,15380.5%White alone
- 1,00713.2%Black alone
- 2002.6%Hispanic
- 1301.7%Asian alone
- 1141.5%Two or more races
- 140.2%Other race alone
- 190.2%American Indian alone
- 60.08%Native Hawaiian and Other
Pacific Islander alone
-
- 8,88065.0%White alone
- 2,87421.0%Black alone
- 9897.2%Two or more races
- 6464.7%Hispanic
- 2421.8%Asian alone
- 500.4%Other race alone
- 220.2%American Indian alone
2000
2022
-
- 8,424,14067.8%White alone
- 1,856,15214.9%Black alone
- 1,530,26212.3%Hispanic
- 419,9163.4%Asian alone
- 153,9961.2%Two or more races
- 13,4790.1%Other race alone
- 18,2320.1%American Indian alone
- 3,1160.03%Native Hawaiian and Other
Pacific Islander alone

-
- 7,356,30158.5%White alone
- 2,299,72618.3%Hispanic
- 1,660,42313.2%Black alone
- 747,2965.9%Asian alone
- 458,5993.6%Two or more races
- 45,3860.4%Other race alone
- 10,4050.08%American Indian alone
- 3,8960.03%Native Hawaiian and Other
Pacific Islander alone

Income and house value in Shiloh
- Median household income in 2022
- $87,889White non-Hispanic householders
- $113,949Black householders
- $107,845Two or more races householders
- $81,989Hispanic or Latino race householders
- Median 2022 house value
- $300,777White Non-Hispanic householders
- $305,387Black or African American householders
- $175,636Asian householders
- $318,780Two or more races householders
- $370,592Hispanic or Latino householders
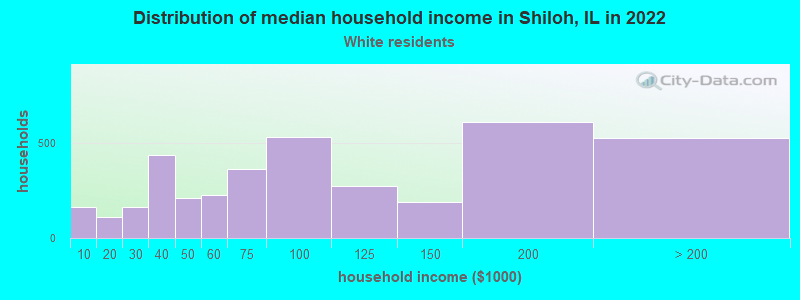
Household income for White non-Hispanic householders
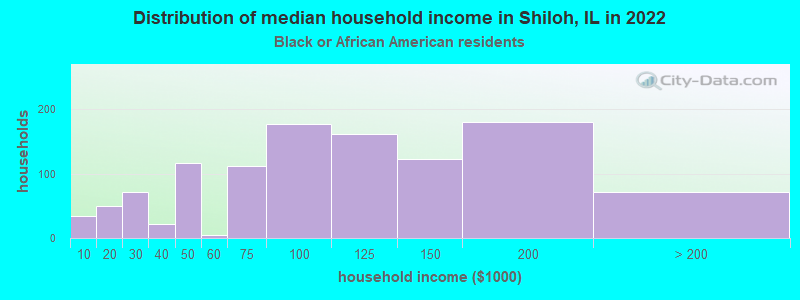
Household income for Black householders
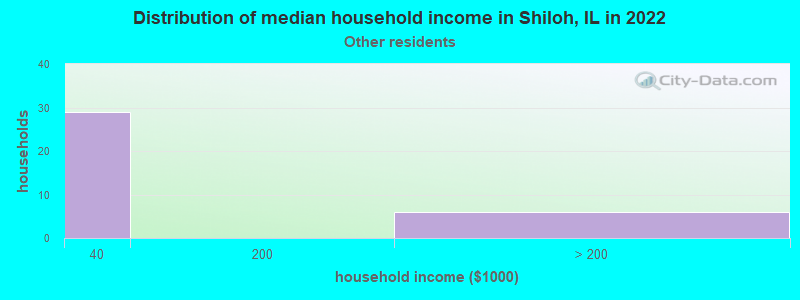
Household income for Some other race householders
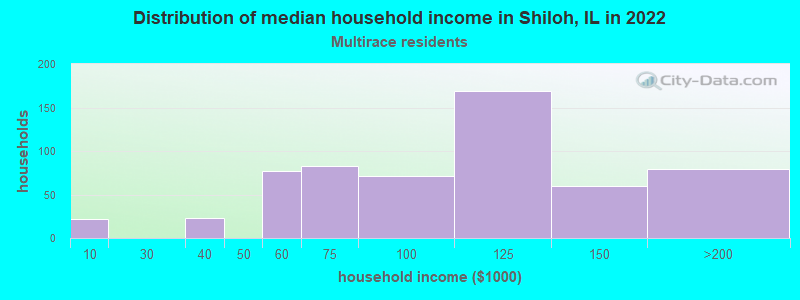
Household income for Two or more races householders
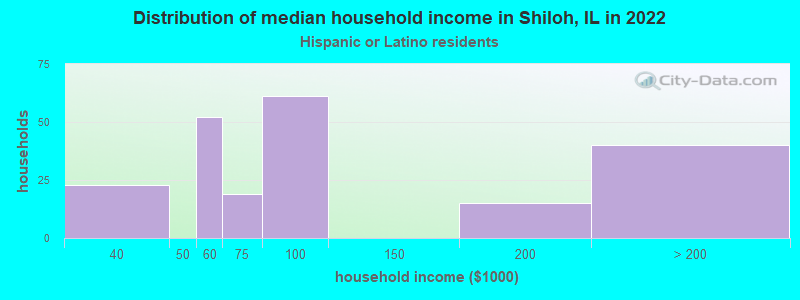
Household income for Hispanic or Latino race householders
Median age by race in Shiloh
- 44.1Median age for White residents
- 39.2Males
- 46.2Females
- 39.4Median age for Black or African American residents
- 28.2Males
- 42.8Females
- 91.6Median age for American Indian / Alaska Native residents
- 84.8Males
- -688,956,432.9Females
- 59.7Median age for Asian residents
- -816,993,463.2Males
- 55.1Females
- -593,236,714.4Median age for Native Hawaiian / Pacific Islander residents
- -666,666,666.0Males
- -576,015,108.0Females
- 45.1Median age for Other race residents
- 31.5Males
- 50.0Females
- 26.7Median age for Two or more races residents
- 22.8Males
- 41.6Females
- 44.2Median age for White alone residents
- 39.5Males
- 47.0Females
- 27.4Median age for Hispanic or Latino residents
- 32.3Males
- 25.3Females
Owner/renter occupied households by race in Shiloh
- House owners and renters - White residents
- 2,85074.5%Owner occupied
- 97825.5%Renter occupied
- House owners and renters - Black or African American residents
- 56950.5%Owner occupied
- 55749.5%Renter occupied
- House owners and renters - Other race residents
- 40100.0%Owner occupied
- House owners and renters - Two or more races residents
- 26651.2%Owner occupied
- 25448.8%Renter occupied
- House owners and renters - White alone residents
- 2,85974.9%Owner occupied
- 95725.1%Renter occupied
- House owners and renters - Hispanic or Latino residents
- 6629.6%Owner occupied
- 15670.4%Renter occupied
Language usage in Shiloh
- English speakers - Total
- 92.9% of residents of Shiloh speak English at home.
- 4.3% of residents speak Spanish at home
- 54295.6%Speak English very well
- 254.4%Speak English less than very well
- 3.0% of residents speak other language at home
- 20752.5%Speak English very well
- 18747.5%Speak English less than very well
- English speakers - Born in the United States
- 94.3% of residents of Shiloh speak English at home.
- 4.1% of residents speak Spanish at home
- 271100.0%Speak English very well
- 1.5% of residents speak other language at home
- 95100.0%Speak English very well
- English speakers - Native, born elsewhere
- 90.4% of residents of Shiloh speak English at home.
- 13.0% of residents speak Spanish at home
- 42100.0%Speak English very well
- English speakers - Foreign-born
- 21.0% of residents of Shiloh speak English at home.
- 25.8% of residents speak Spanish at home
- 10985.2%Speak English very well
- 1914.8%Speak English less than very well
- 56.9% of residents speak other language at home
- 12444.0%Speak English very well
- 15856.0%Speak English less than very well
White (Caucasian) - Speak only English
| Native: | 97.5% (8,206) |
| Foreign-born: | 57.1% (46) |
White (Caucasian) - Speak another language
| Native: | 2.2% (188) |
| Foreign-born: | 42.7% (34) |
Black or African American - Speak only English
| Native: | 92.6% (2,565) |
| Foreign-born: | 33.9% (39) |
Black or African American - Speak another language
| Native: | 7.4% (204) |
| Foreign-born: | 66.2% (76) |
Two or more races - Speak another language
| Native: | 7.3% (100) |
| Foreign-born: | 100.0% (29) |
White alone - Speak only English
| Native: | 98.8% (8,187) |
| Foreign-born: | 52.4% (56) |
White alone - Speak another language
| Native: | 1.2% (96) |
| Foreign-born: | 46.2% (50) |
Hispanic or Latino - Speak another language
| Native: | 49.0% (293) |
| Foreign-born: | 100.0% (64) |
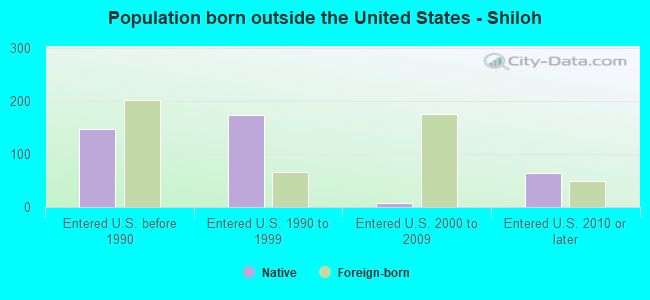
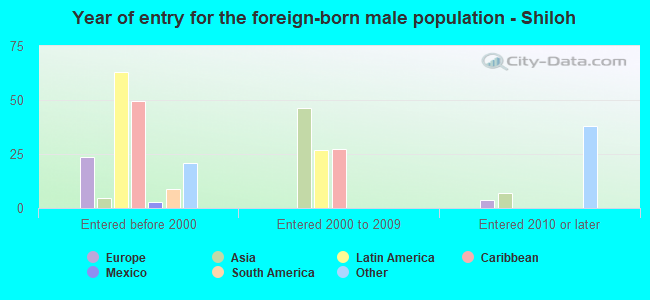
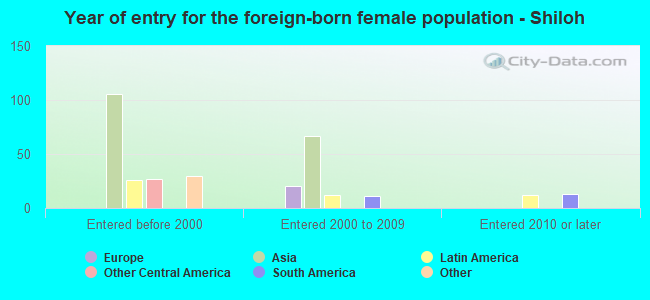
Foreign-born residents in Shiloh
525 residents are foreign born (1.8% Asia, 1.0% Latin America, 0.5% Africa).
| This city: | 3.8% |
| Illinois: | 14.1% |

Marital status for residents in Shiloh
Marital status - White (Caucasian) population 15 years and over
- Males
- 29.4%Never married
- 60.2%Now married
- 0.5%Separated
- 4.8%Widowed
- 5.1%Divorced
- Females
- 19.1%Never married
- 53.9%Now married
- 1.2%Separated
- 10.0%Widowed
- 15.8%Divorced
Women who gave birth in the past 12 months
| Now married: | 100.0% (51) |
| Unmarried: | 0.0% (0) |
Women who did not give birth in the past 12 months
| Now married: | 52.4% (945) |
| Unmarried: | 47.6% (859) |
Marital status - Black or African American population 15 years and over
- Males
- 42.8%Never married
- 49.7%Now married
- 0.0%Separated
- 1.1%Widowed
- 6.5%Divorced
- Females
- 26.3%Never married
- 54.1%Now married
- 7.8%Separated
- 4.8%Widowed
- 6.9%Divorced
Women who did not give birth in the past 12 months
| Now married: | 66.7% (502) |
| Unmarried: | 33.3% (251) |
Marital status - American Indian / Alaska Native population 15 years and over
- Males
- 33.3%Never married
- 66.7%Now married
- 0.0%Separated
- 0.0%Widowed
- 0.0%Divorced
- Females
- 100.0%Never married
- 0.0%Now married
- 0.0%Separated
- 0.0%Widowed
- 0.0%Divorced
Women who did not give birth in the past 12 months
| Now married: | 0.0% (0) |
| Unmarried: | 100.0% (20) |
Marital status - Asian population 15 years and over
- Males
- 12.0%Never married
- 88.0%Now married
- 0.0%Separated
- 0.0%Widowed
- 0.0%Divorced
- Females
- 0.0%Never married
- 100.0%Now married
- 0.0%Separated
- 0.0%Widowed
- 0.0%Divorced
Women who did not give birth in the past 12 months
| Now married: | 100.0% (23) |
| Unmarried: | 0.0% (0) |
Marital status - Other race population 15 years and over
- Males
- 78.8%Never married
- 21.2%Now married
- 0.0%Separated
- 0.0%Widowed
- 0.0%Divorced
- Females
- 0.0%Never married
- 12.8%Now married
- 87.2%Separated
- 0.0%Widowed
- 0.0%Divorced
Women who did not give birth in the past 12 months
| Now married: | 100.0% (36) |
| Unmarried: | 0.0% (0) |
Marital status - Two or more races population 15 years and over
- Males
- 47.8%Never married
- 31.7%Now married
- 0.0%Separated
- 0.0%Widowed
- 20.5%Divorced
- Females
- 31.2%Never married
- 27.3%Now married
- 8.1%Separated
- 0.0%Widowed
- 33.4%Divorced
Women who did not give birth in the past 12 months
| Now married: | 36.1% (141) |
| Unmarried: | 63.9% (250) |
Marital status - White alone, not Hispanic / Latino population 15 years and over
- Males
- 28.0%Never married
- 61.3%Now married
- 0.5%Separated
- 4.9%Widowed
- 5.3%Divorced
- Females
- 17.9%Never married
- 54.6%Now married
- 1.3%Separated
- 10.3%Widowed
- 16.0%Divorced
Women who gave birth in the past 12 months
| Now married: | 100.0% (53) |
| Unmarried: | 0.0% (0) |
Women who did not give birth in the past 12 months
| Now married: | 54.0% (951) |
| Unmarried: | 46.0% (808) |
Marital status - Hispanic or Latino population 15 years and over
- Males
- 59.1%Never married
- 24.2%Now married
- 0.0%Separated
- 0.0%Widowed
- 16.8%Divorced
- Females
- 35.1%Never married
- 42.9%Now married
- 14.7%Separated
- 0.0%Widowed
- 7.4%Divorced
Women who did not give birth in the past 12 months
| Now married: | 49.2% (103) |
| Unmarried: | 50.8% (106) |
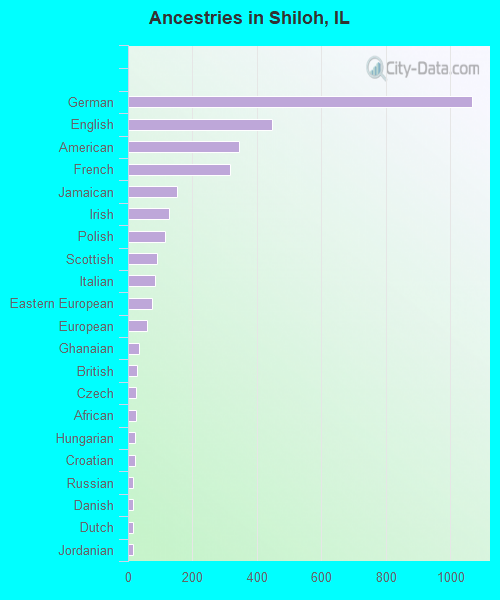
Ancestries in Shiloh

- 1,06718.2%German
- 4477.6%English
- 3445.9%American
- 3165.4%French
- 1532.6%Jamaican
- 1282.2%Irish
- 1141.9%Polish
- 891.5%Scottish
- 831.4%Italian
- 751.3%Eastern European
- 601.0%European
- 340.6%Ghanaian
- 270.5%British
- 250.4%Czech
- 240.4%African
- 220.4%Hungarian
- 210.4%Croatian
- 160.3%Russian
- 150.3%Danish
- 150.3%Dutch
- 140.2%Jordanian
- 80.1%Palestinian
- 70.1%Scotch-Irish
- 40.07%Norwegian
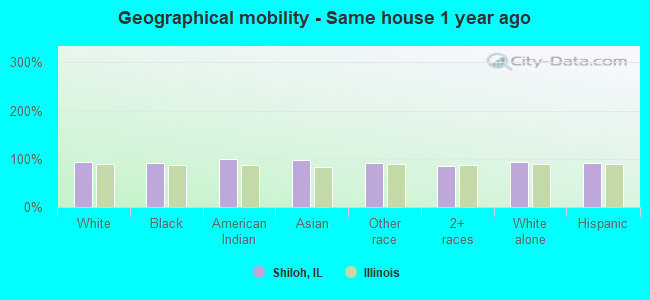
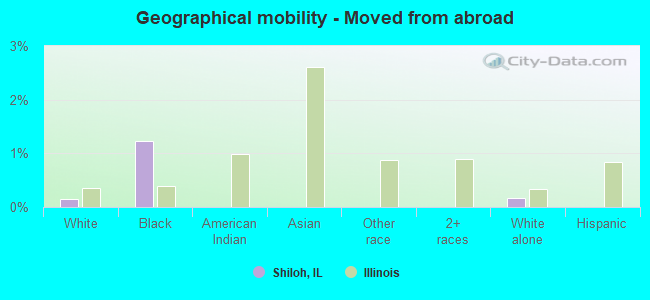
Geographical mobility in Shiloh

- Same house 1 year ago
- 8,31493.0%White (Caucasian)
- 2,64191.6%Black or African American
- 9399.7%American Indian / Alaska Native
- 23696.9%Asian
- 12090.7%Other race
- 1,29085.7%Two or more races
- 8,24493.2%White alone, not Hispanic / Latino
- 57691.2%Hispanic or Latino
-
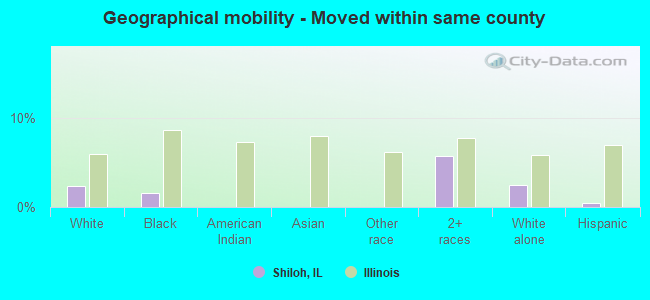
- Moved within same county
- 2112.4%White / Caucasian
- 451.6%Black or African American
- 865.7%Two or more races
- 2142.4%White alone, not Hispanic / Latino
- 30.4%Hispanic or Latino
-
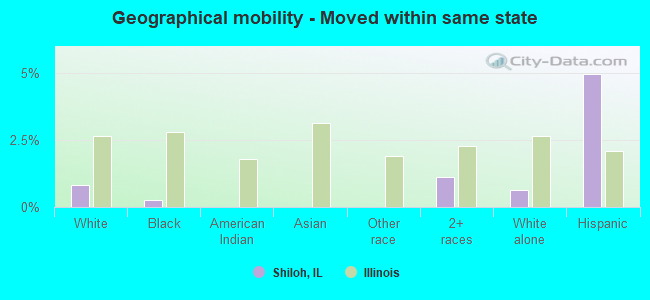
- Moved within same state
- 740.8%White / Caucasian
- 70.3%Black or African American
- 171.1%Two or more races
- 560.6%White alone, not Hispanic / Latino
- 315.0%Hispanic or Latino
-
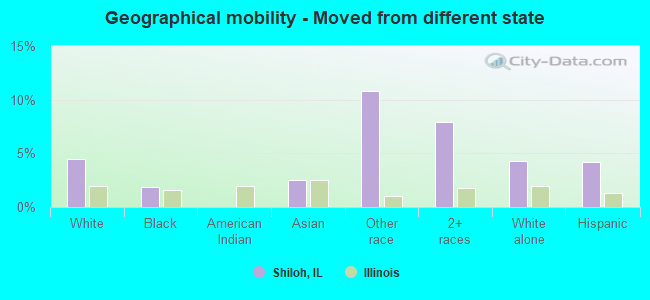
- Moved from different state
- 4014.5%White / Caucasian
- 551.9%Black or African American
- 62.5%Asian
- 1410.9%Other race
- 1197.9%Two or more races
- 3814.3%White alone, not Hispanic / Latino
- 264.2%Hispanic or Latino
-
- Moved from abroad
- 140.2%White
- 351.2%Black or African American
- 150.2%White alone, not Hispanic / Latino
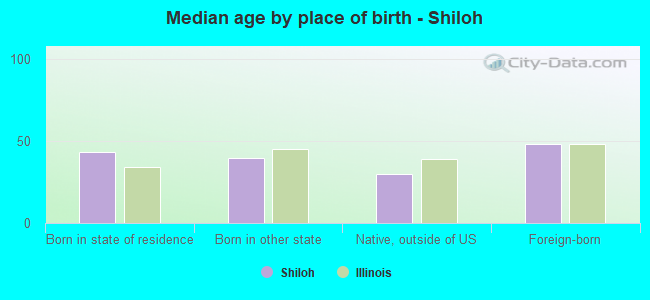
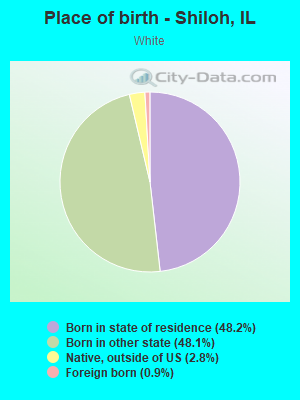
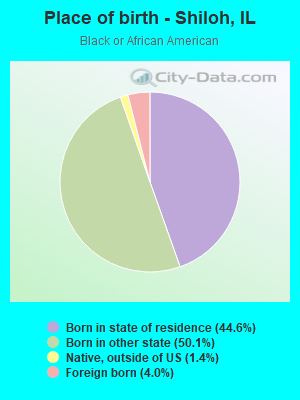
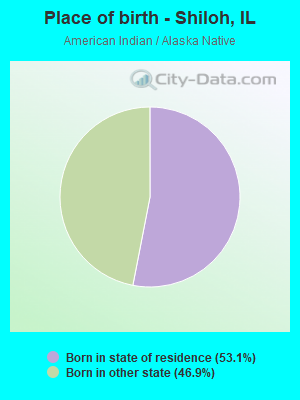
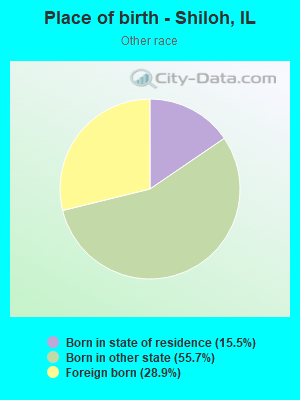
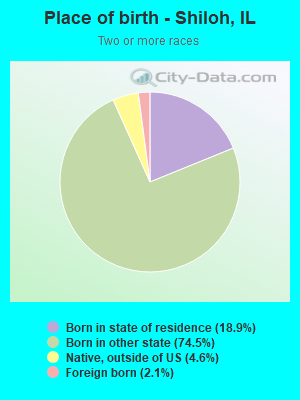
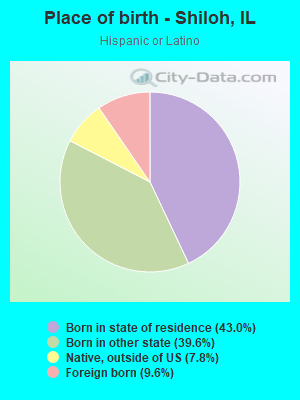
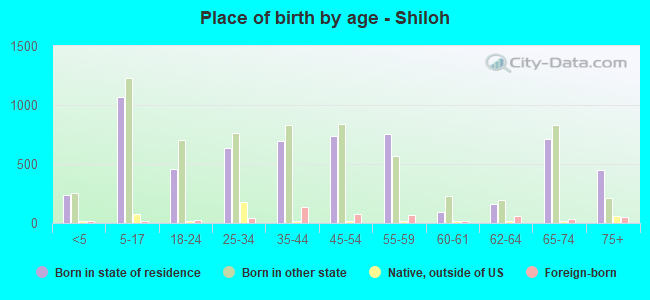
Children Nativity (place of birth) in Shiloh
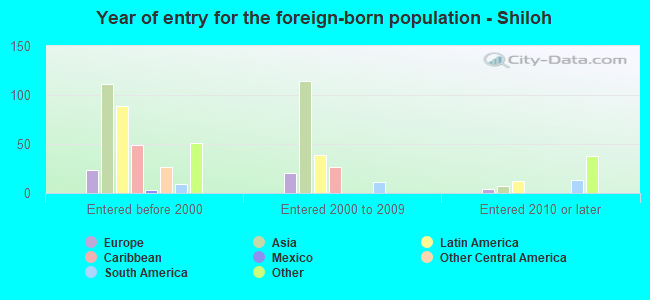
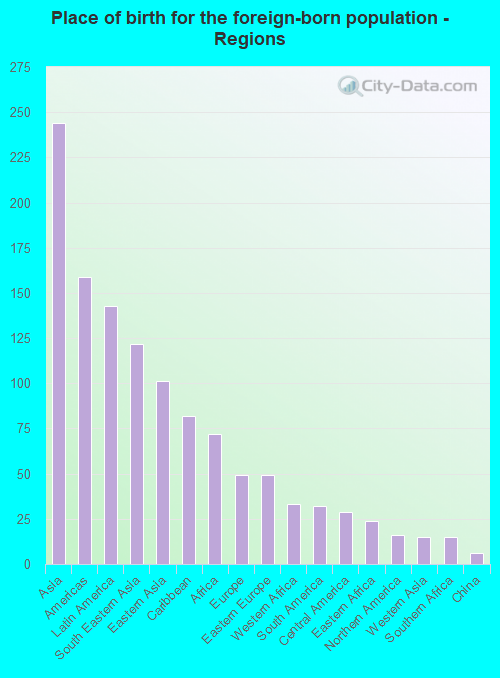
Place of birth for residents in Shiloh
![Place of birth for the foreign-born population - Regions]()
- 244Asia
- 159Americas
- 143Latin America
- 122South Eastern Asia
- 101Eastern Asia
- 82Caribbean
- 72Africa
- 49Europe
- 49Eastern Europe
- 33Western Africa
- 32South America
- 29Central America
- 24Eastern Africa
- 16Northern America
- 15Western Asia
- 15Southern Africa
- 6China
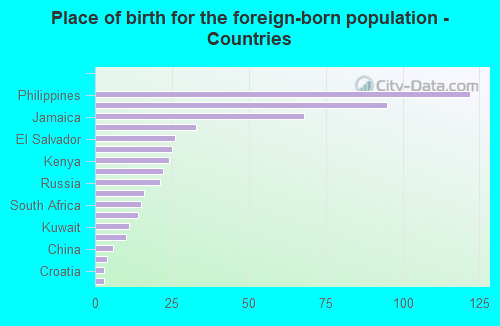
![Place of birth for the foreign-born population - Countries]()
- 122Philippines
- 95Korea
- 68Jamaica
- 33Ghana
- 26El Salvador
- 25Hungary
- 24Kenya
- 22Colombia
- 21Russia
- 16Canada
- 15South Africa
- 14Cuba
- 11Kuwait
- 10Ecuador
- 6China
- 4Jordan
- 3Croatia
- 3Mexico
Grandparents responsible for own grandchildren in Shiloh
Zip codes: 62221.