Union: Fire Incidents, New Jersey (NJ)
Where are fire incidents reported in Union, NJ
Something went wrong! Please refresh the page.
| Fire incidents reported | |
|---|---|
| Sreet name | Count |
| MORRIS AV | 1,216 |
| STUYVESANT AV | 396 |
| U.S. HWY 22 W | 154 |
| VAUXHALL RD | 150 |
| LEHIGH AV | 140 |
| CHESTNUT ST | 136 |
| GARDEN STATE PKWY N | 118 |
| BURNET AV | 114 |
| GARDEN STATE PKWY S | 100 |
| INTERSTATE HWY 78 W | 100 |
| GALLOPING HILL RD | 98 |
| U.S. HWY 22 E | 86 |
| INTERSTATE HWY 78 E | 84 |
| US HWY 22 W | 82 |
| COMMERCE AV | 78 |
| FRANCES CT | 76 |
| MANOR DR | 74 |
| SALEM RD | 74 |
| LIBERTY AV | 56 |
| CALDWELL AV | 54 |
| US HWY 22 E | 54 |
| WALKER AV | 54 |
| COLONIAL AV | 50 |
| HUDSON ST | 50 |
| SUMNER AV | 46 |
| GREEN LA | 44 |
| SPRINGFIELD RD | 44 |
| U.S. HWY 22 C/I | 44 |
| WEST CHESTNUT ST | 42 |
| SPRINGFIELD AV | 40 |
2003 - 2018 National Fire Incident Reporting System (NFIRS) incidents
- Incident types reported to NFIRS in Union, NJ
- 10,60931.4%Hazardous Condition
- 9,99729.6%Rescue & EMS
- 3,82811.3%False Alarm
- 3,70711.0%Fire
- 2,7208.0%Service Call
- 2,2456.6%Good Intent Call
- 4641.4%Severe Weather
- 2210.7%Overpressure Rupture
- Fire incident types reported to NFIRS in Union, NJ
- 1,71546.3%Structure Fires
- 1,19432.2%Outside Fires
- 62316.8%Mobile Property/Vehicle Fires
- 1754.7%Other
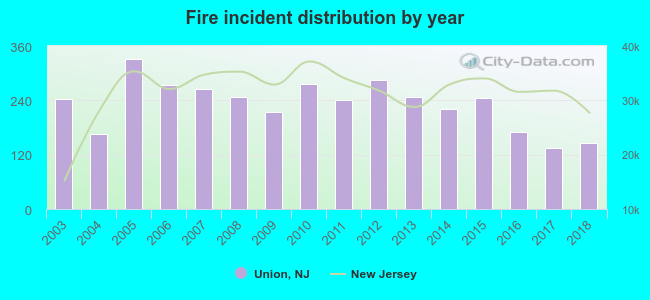 Based on the data from the years 2003 - 2018 the average number of fire incidents per year is 232. The highest number of fire incidents - 331 took place in 2005, and the least - 135 in 2017. The data has a decreasing trend.
The average number of yearly fire incidents per 10k residents in Union, NJ compared to nearest cities:
(Note: Based on data for the last 3 years, including only cities with population 5,000 and above)
| Union: | 27.8 |
| Kenilworth: | 14.3 |
| Roselle Park: | 13.5 |
| Hillside: | 34.1 |
| Maplewood: | 42.0 |
| Springfield: | 44.0 |
| Irvington: | 26.2 |
| Roselle: | 24.1 |
| Cranford: | 27.6 |
 The median response time based on all reported fire incidents is 5 minutes. This is comparable to the state median value.
The median response time in Union, NJ compared to nearest cities:
(Note: Based on data for all years, including only cities with at least 500 fire incidents)
| Union: | 5 minutes |
| Hillside: | 3 minutes |
| Maplewood: | 3 minutes |
| Springfield: | 5 minutes |
| Irvington: | 3 minutes |
| Roselle: | 3 minutes |
| Cranford: | 4 minutes |
| South Orange: | 3 minutes |
| Millburn: | 4 minutes |
 According to the data from the years 2003 - 2018 the average number of fire-related yearly deaths is 1. The highest number of reported deaths - 6 took place in 2007, and the lowest - 0 in 2003. The data has an increasing trend.
The average number of deaths per 1,000 fires is 3. This indicator was the highest - 23 in 2007, and the lowest 0 in 2003. The trend for deaths per 1,000 fire incidents is increasing. Compared to the New Jersey value the number of fatalities per 1,000 fires is higher.
According to the data from the years 2003 - 2018 the average number of fire-related yearly deaths is 1. The highest number of reported deaths - 6 took place in 2007, and the lowest - 0 in 2003. The data has an increasing trend.
The average number of deaths per 1,000 fires is 3. This indicator was the highest - 23 in 2007, and the lowest 0 in 2003. The trend for deaths per 1,000 fire incidents is increasing. Compared to the New Jersey value the number of fatalities per 1,000 fires is higher.Deaths per 1,000 incidents in Union, NJ compared to nearest cities:
(Note: Based on data for all years, including only cities with at least 2,500 fire incidents)
| Union: | 2.7 |
| Irvington: | 2.9 |
| Elizabeth: | 1.3 |
| Newark: | 1.3 |
| East Orange: | 3.9 |
| Jersey City: | 0.9 |
| Perth Amboy: | 2.4 |
| Hoboken: | 0.7 |
 Based on the data from the years 2003 - 2018 the average number of fire-related casualties per year is 6. The highest number of casualties - 15 took place in 2005, and the lowest - 0 in 2015. The data has a declining trend.
The average number of casualties per 1,000 fire incidents is 24. This indicator was the highest - 67 in 2004, and the lowest 0 in 2015. The trend for injuries per 1,000 incidents is dropping. Compared to the state value the number of casualties per 1,000 incidents is much higher.
Based on the data from the years 2003 - 2018 the average number of fire-related casualties per year is 6. The highest number of casualties - 15 took place in 2005, and the lowest - 0 in 2015. The data has a declining trend.
The average number of casualties per 1,000 fire incidents is 24. This indicator was the highest - 67 in 2004, and the lowest 0 in 2015. The trend for injuries per 1,000 incidents is dropping. Compared to the state value the number of casualties per 1,000 incidents is much higher.Casualties per 1,000 incidents in Union, NJ compared to nearest cities:
(Note: Based on data for all years, including only cities with at least 500 fire incidents)
| Union: | 26.2 |
| Hillside: | 3.4 |
| Maplewood: | 18.6 |
| Springfield: | 6.7 |
| Irvington: | 15.3 |
| Roselle: | 28.9 |
| Cranford: | 19.9 |
| South Orange: | 8.9 |
| Millburn: | 6.9 |
 30.4% incidents where reported in the morning and 69.6% in the evening. The most fires (16.5%) took place on Saturday, and the least (13.3%) on Thursday.
 Based on the 3,707 fire incident reports from years 2003 - 2018 most fires (11.2%) took place during May, and the least (6.6%) in December.
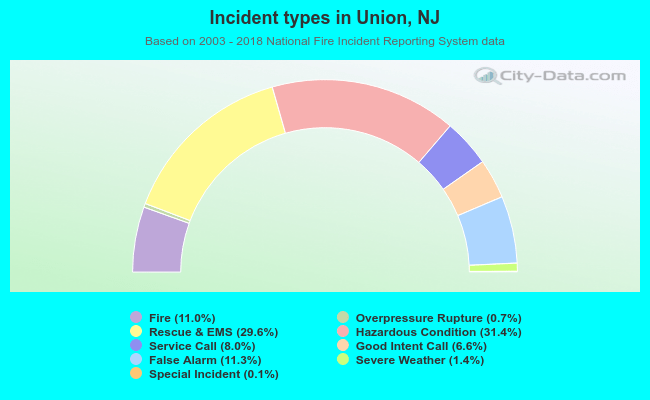 Out of all 33,818 cases reported during the years 2003 - 2018, the most belonged to the categories: Hazardous Condition (31.4%), Rescue & EMS (29.6%), and False Alarm (11.3%).
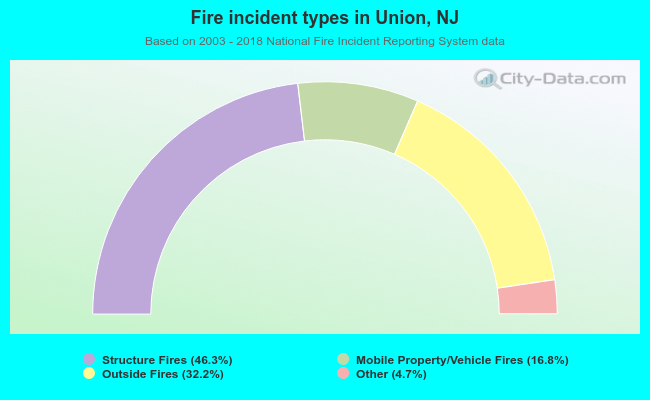 When looking into fire subcategories, the most incidents belonged to: Structure Fires (46.3%), and Outside Fires (32.2%).