Maplewood: Fire Incidents, New Jersey (NJ)
Where are fire incidents reported in Maplewood, NJ
Something went wrong! Please refresh the page.
| Fire incidents reported | |
|---|---|
| Sreet name | Count |
| SPRINGFIELD AVE | 114 |
| MAPLEWOOD AVE | 74 |
| BOYDEN AVE | 68 |
| JACOBY ST | 64 |
| SPRINGFIELD AV | 56 |
| PARKER AVE | 52 |
| VALLEY ST | 48 |
| IRVINGTON AVE | 44 |
| PROSPECT ST | 36 |
| RUTGERS ST | 36 |
| OAKLAND RD | 32 |
| RIDGEWOOD RD | 26 |
| SPRINGFIELD AVMAPLEWOOD | 26 |
| BOYDEN AV | 24 |
| FRANKLIN AVE | 22 |
| TUSCAN RD | 22 |
| DUNNELL RD | 20 |
| ELMWOOD AVE | 20 |
| HUGHES ST | 20 |
| BURNETT AVE | 18 |
| ELMWOOD AV | 18 |
| IRVINGTON AV | 18 |
| MEADOWBROOK RD | 18 |
| MIDLAND BLVD | 18 |
| MILLBURN AVE | 18 |
| NEWARK WAY | 18 |
| SALTER PL | 18 |
| BOYDEN AVE | 16 |
| DUNNELL RD | 16 |
| EVELYN CT | 16 |
| Other | 134 |
2002 - 2018 National Fire Incident Reporting System (NFIRS) incidents
- Incident types reported to NFIRS in Maplewood, NJ
- 8,04644.7%Rescue & EMS
- 4,61225.6%Hazardous Condition
- 1,6129.0%Service Call
- 1,5978.9%False Alarm
- 1,1306.3%Fire
- 8474.7%Good Intent Call
- 1020.6%Severe Weather
- 350.2%Overpressure Rupture
- Fire incident types reported to NFIRS in Maplewood, NJ
- 80371.1%Structure Fires
- 22820.2%Outside Fires
- 918.1%Mobile Property/Vehicle Fires
- 80.7%Other
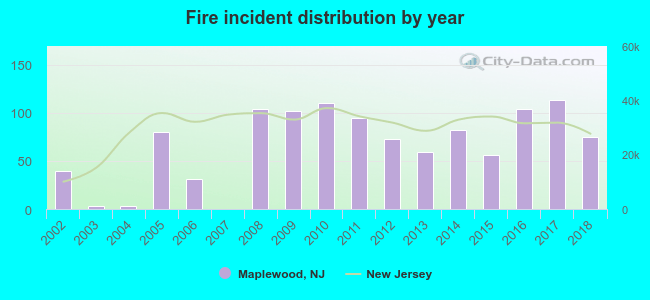 Based on the data from the years 2002 - 2018 the average number of fire incidents per year is 66. The highest number of fire incidents - 113 took place in 2017, and the least - 0 in 2007. The data has an increasing trend.
The average number of yearly fire incidents per 10k residents in Maplewood, NJ compared to nearest cities:
(Note: Based on data for the last 3 years, including only cities with population 5,000 and above)
| Maplewood: | 42.0 |
| South Orange: | 24.3 |
| Irvington: | 26.2 |
| Union: | 27.8 |
| Millburn: | 10.6 |
| Hillside: | 34.1 |
| Orange: | 24.7 |
| Short Hills: | 49.6 |
| Springfield: | 44.0 |
 The median response time based on all reported fire incidents is 3 minutes. This is lower than the state median value.
The median response time in Maplewood, NJ compared to nearest cities:
(Note: Based on data for all years, including only cities with at least 500 fire incidents)
| Maplewood: | 3 minutes |
| South Orange: | 3 minutes |
| Irvington: | 3 minutes |
| Union: | 5 minutes |
| Millburn: | 4 minutes |
| Hillside: | 3 minutes |
| Orange: | 3 minutes |
| Short Hills: | 5 minutes |
| Springfield: | 5 minutes |
 According to the reports from the years 2002 - 2018 the average number of fire-related yearly casualties is 1. The highest number of casualties - 8 took place in 2010, and the lowest - 0 in 2002. The data has a constant trend.
The average number of casualties per 1,000 fires is 14. This indicator was the highest - 73 in 2010, and the lowest 0 in 2002. The trend for casualties per 1,000 fire incidents is constant. Compared to the state value the number of casualties per 1,000 fires is much higher.
According to the reports from the years 2002 - 2018 the average number of fire-related yearly casualties is 1. The highest number of casualties - 8 took place in 2010, and the lowest - 0 in 2002. The data has a constant trend.
The average number of casualties per 1,000 fires is 14. This indicator was the highest - 73 in 2010, and the lowest 0 in 2002. The trend for casualties per 1,000 fire incidents is constant. Compared to the state value the number of casualties per 1,000 fires is much higher.Casualties per 1,000 incidents in Maplewood, NJ compared to nearest cities:
(Note: Based on data for all years, including only cities with at least 500 fire incidents)
| Maplewood: | 18.6 |
| South Orange: | 8.9 |
| Irvington: | 15.3 |
| Union: | 26.2 |
| Millburn: | 6.9 |
| Hillside: | 3.4 |
| Orange: | 6.0 |
| Short Hills: | 7.0 |
| Springfield: | 6.7 |
 30.4% incidents where reported in the morning and 69.6% in the evening. The most fires (18.1%) took place on Sunday, and the least (11.2%) on Tuesday.
 Based on the 1,130 fires from years 2002 - 2018 most fires (11.3%) took place during February, and the least (4.8%) in September.
 Out of all 17,992 cases reported during the years 2002 - 2018, the most belonged to the categories: Rescue & EMS (44.7%), Hazardous Condition (25.6%), and Service Call (9.0%).
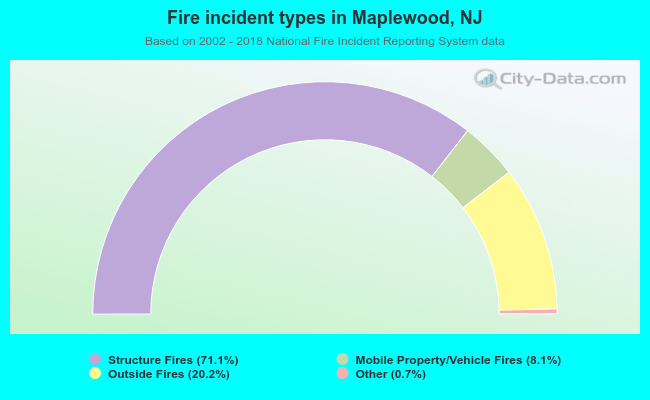 When looking into fire subcategories, the most incidents belonged to: Structure Fires (71.1%), and Outside Fires (20.2%).